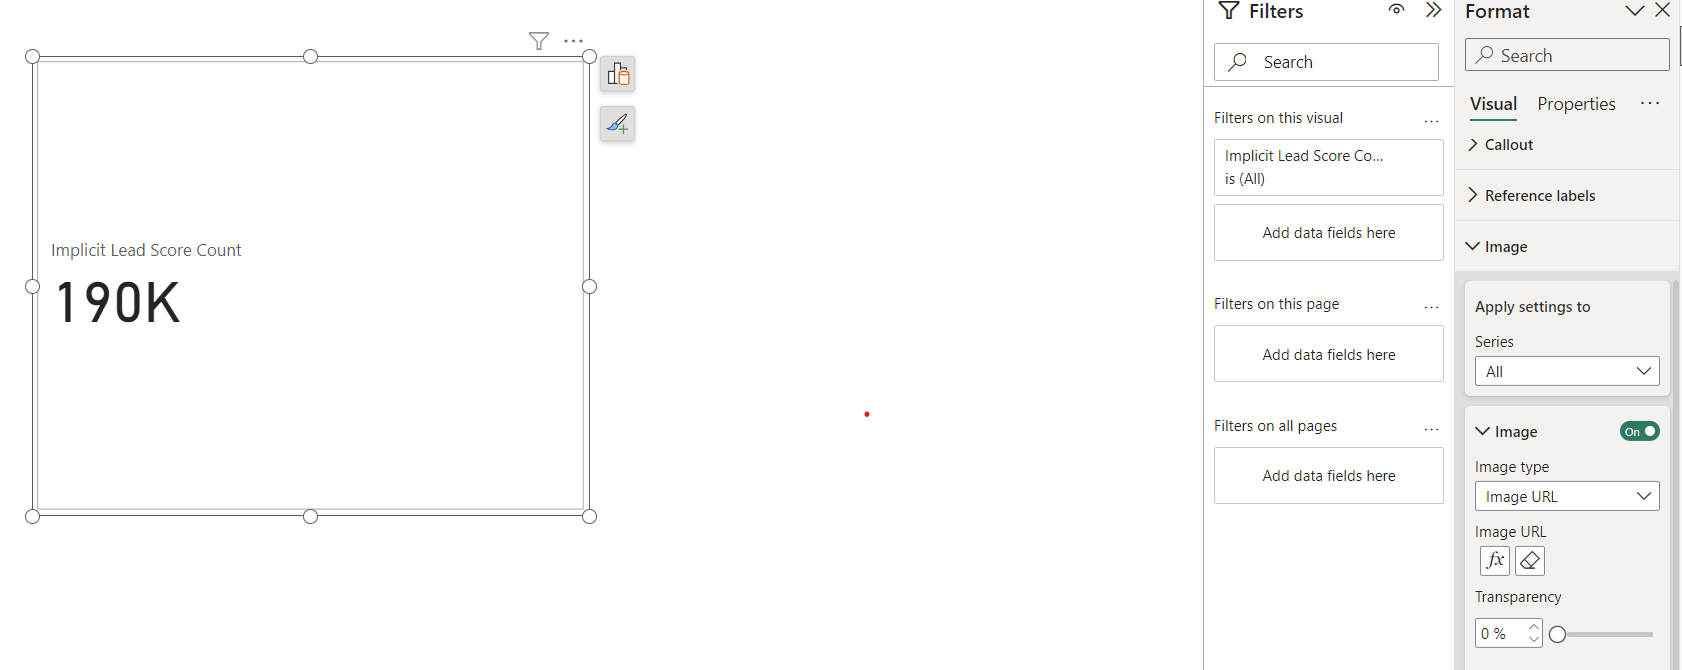
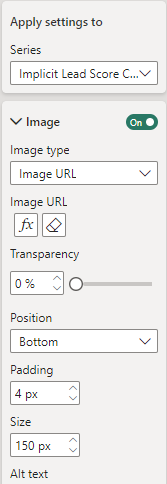
Hi, I am trying to add an SVG image to a card visual and it is not working. Can someone see what the issue could be. Below is the DAX. I have set the Data category to Image URL so I don’t know what the issue could be. Thanks in advance.
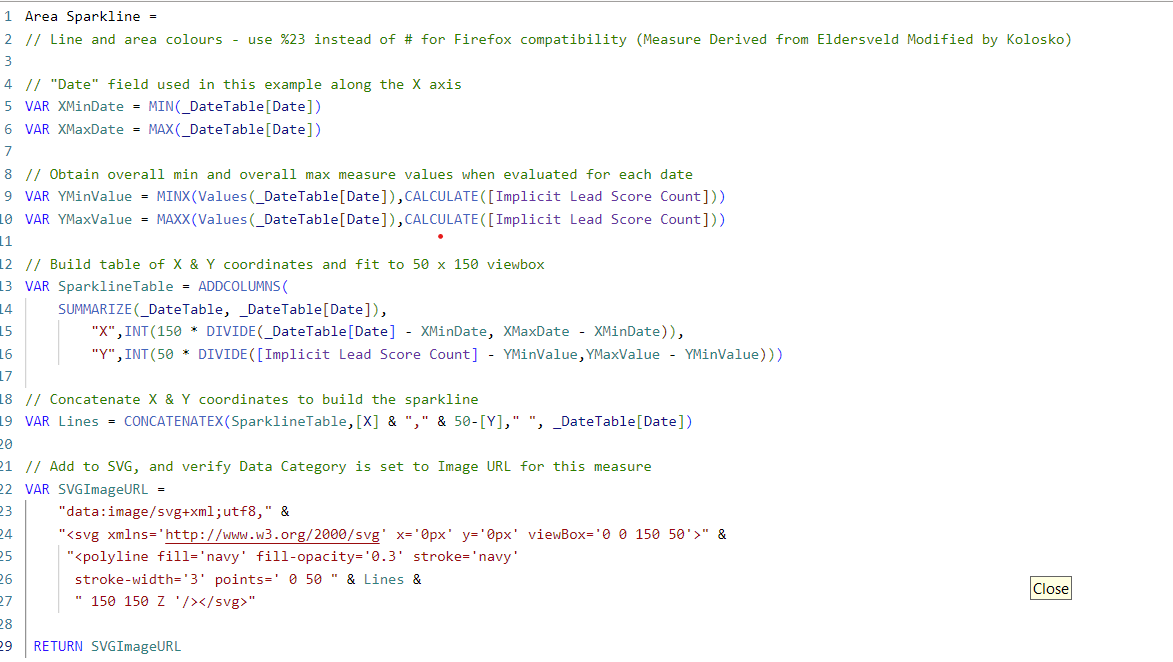
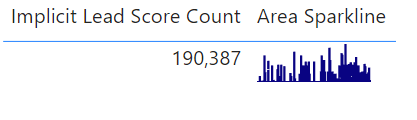
Area Sparkline =
// Line and area colours - use %23 instead of # for Firefox compatibility (Measure Derived from Eldersveld Modified by Kolosko)
// “Date” field used in this example along the X axis
VAR XMinDate = MIN(_DateTable[Date])
VAR XMaxDate = MAX(_DateTable[Date])
// Obtain overall min and overall max measure values when evaluated for each date
VAR YMinValue = MINX(Values(_DateTable[Date]),CALCULATE([Implicit Lead Score Count]))
VAR YMaxValue = MAXX(Values(_DateTable[Date]),CALCULATE([Implicit Lead Score Count]))
// Build table of X & Y coordinates and fit to 50 x 150 viewbox
VAR SparklineTable = ADDCOLUMNS(
SUMMARIZE(_DateTable, _DateTable[Date]),
“X”,INT(150 * DIVIDE(_DateTable[Date] - XMinDate, XMaxDate - XMinDate)),
“Y”,INT(50 * DIVIDE([Implicit Lead Score Count] - YMinValue,YMaxValue - YMinValue)))
// Concatenate X & Y coordinates to build the sparkline
VAR Lines = CONCATENATEX(SparklineTable,[X] & “,” & 50-[Y]," ", _DateTable[Date])
// Add to SVG, and verify Data Category is set to Image URL for this measure
VAR SVGImageURL =
“data:image/svg+xml;utf8,” &
“” &
“”
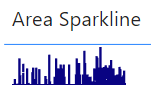
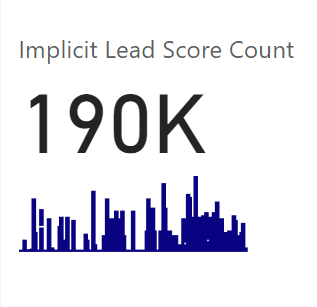
Look at the below videos based on the new card visual. It is using the same source from Kerry’s.You can add it in the new card visual that was released a couple of months ago.