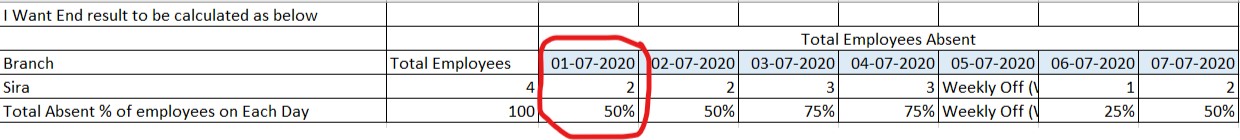
I require Support in writing DAX measure to get the end result like I got in sheet 4 of attached excel.
Am Basically trying to find the total percent of employees Absent without applying (Regularization or Outdoor request) on each day in a particular branch like I have mentioned in the sheet 4.
That layout doesn’t seem possible, also for 01/07 you have shown 2 employees as absent while on this day 3 employees were absent, can you please confirm?
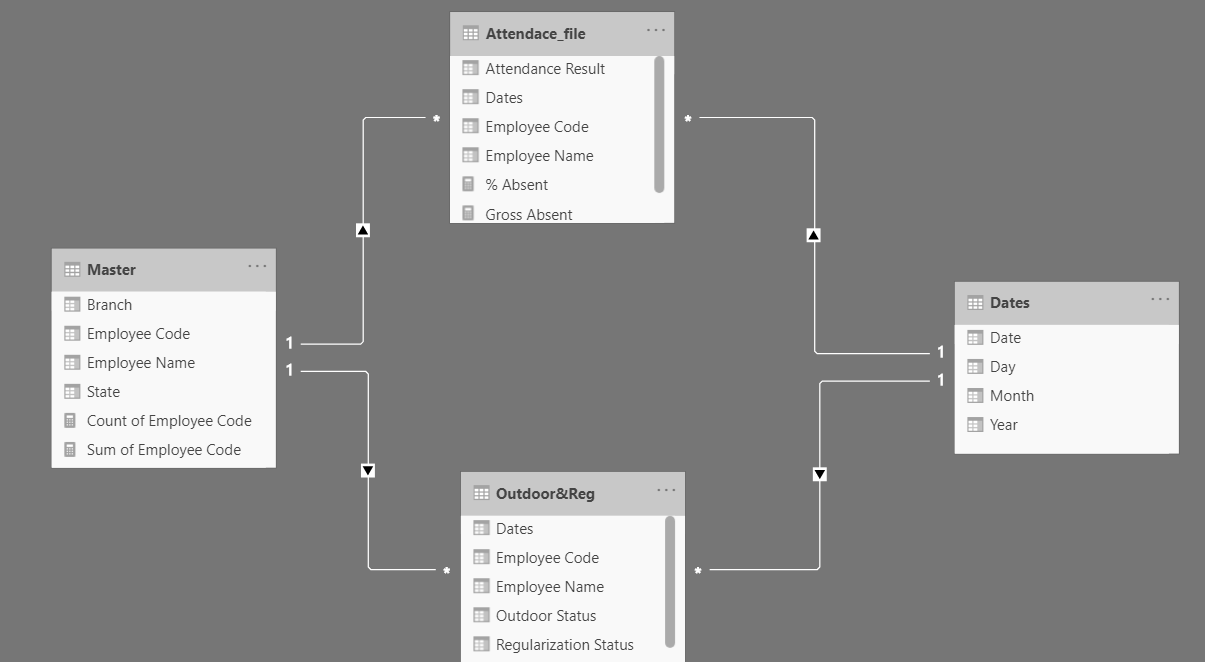
I have modelled the files a bit if anyone else is also starting on this:
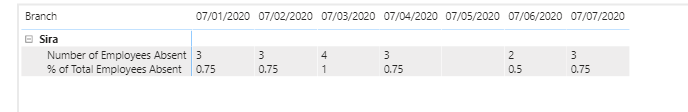
In the mean time, figures look like this. Although I was a bit in doubt about the model, like @AntrikshSharma I placed the Regularization and Outdoor tables on top.
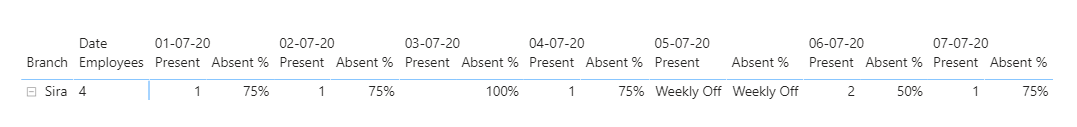
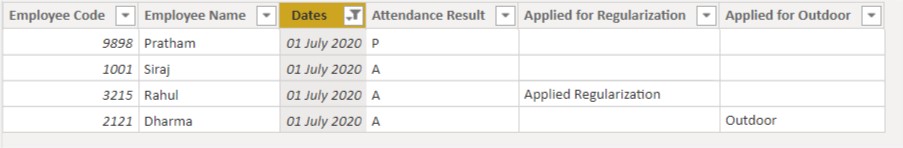
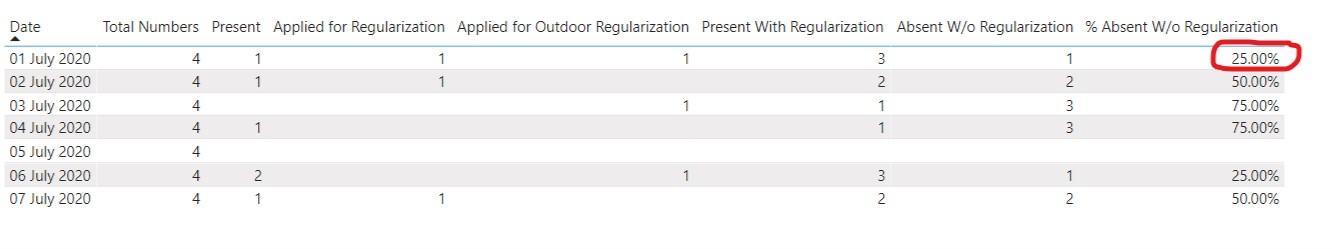
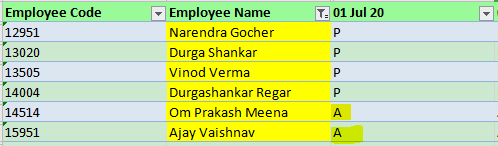
In your Excel file, in the “Attendance File” worksheet it shows 3 employees were Absent and out of which 1 employee has “Applied for Regularization” and 1 has applied for “Outdoor” request so ideally 3 employees should be present on 01-07-2020 whereas in your file under “Sheet 4” result you’ve showed only 2 employees were present. Below is the screenshot provided for the reference.
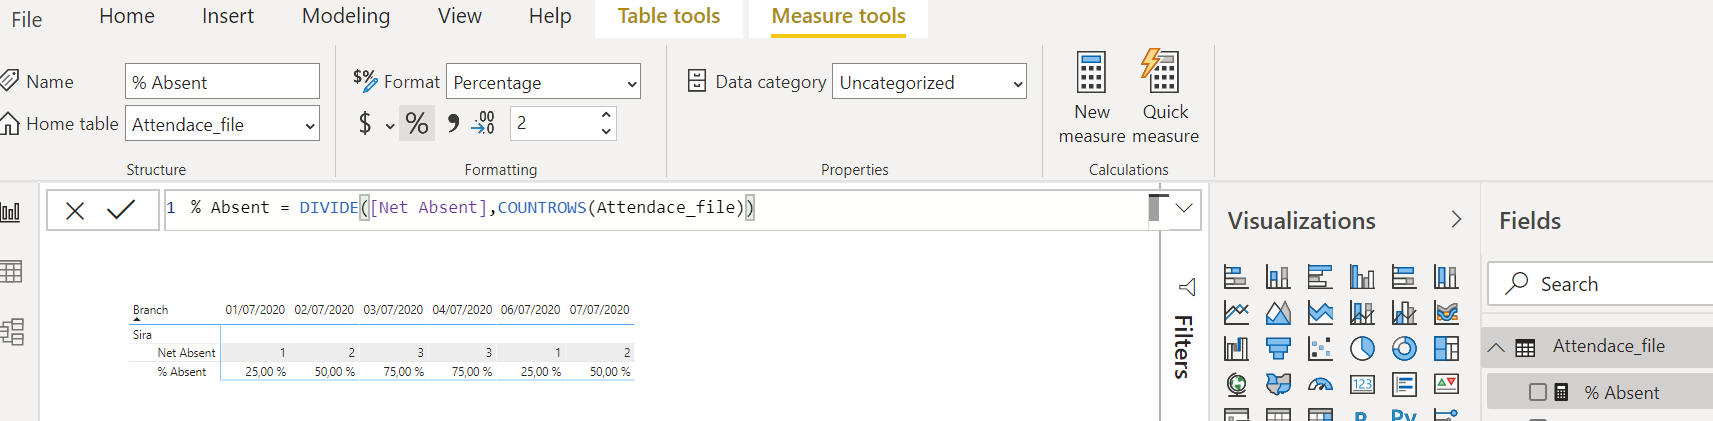
Now as per your, calculation it shows the % rate is 50% whereas in my calculation if I consider these employees as present then the absent rate for that day will fall down to 25%. Below is the screenshot provided for the reference.
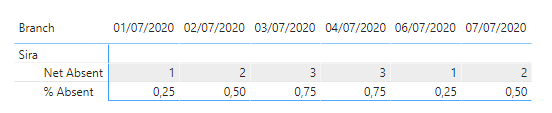
Lots of great thinking above. I always find it helpful when lots of alternative approaches are presented, so here’s the very simple approach I took. I just started with @AntrikshSharma’s structure and built the following branched measure and then dropped it in the values well of the matrix.
The main downside of this approach is that both rows are returned via the exact same measure ( UNICHAR(10) is the code for a hard return, so it looks like two separate measures are being returned when in fact it’s only one concatenated with a hard return), which means that you can only apply one format type so the percentage line gets formatted as a decimal rather than a percentage. But otherwise I think it’s a pretty cool “cheat” that I use a lot in different contexts.
I hope this is helpful. Full solution file attached below.
Hi @BrianJ, @Melissa
Thank you
I think that having multiple solutions for a post could add value to the forum (in some cases). But not sure if this is extra work for you guys
Best
Diego
The forum is so active these days, with so many knowledgeable members posting great solutions, that often I’ll start working on a solution, and by the time I go to post it two or three other people already may have responded and there may be a solution accepted (which is awesome). In that case, I almost always go ahead and post my solution anyway, just to add additional perspective and perhaps a alternative way of doing the same thing, and would encourage others to do the same since I think it adds a lot of richness to the thread and is valuable as a reference for people with the same issue in the future.
@BrianJ
Hahaha this is true. It is like the wild west, people shooting their revolver really fast and accurately. Some of them even with a quite extensive and developed explanation.
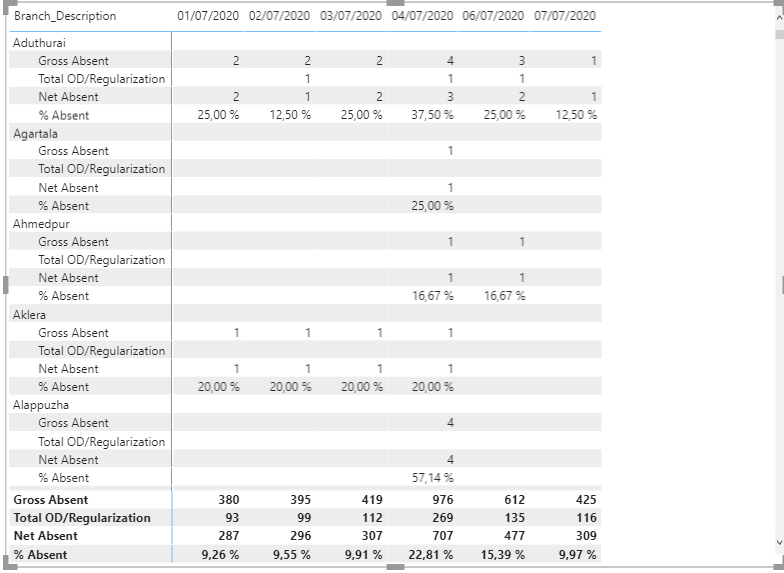
Sorry to bother you again my Friend but am really stuck again I have replicated the DAX what you mentioned in the above using my actual filesAbsentism Report.xlsx (421.5 KB) Branch_Absent.pbix (354.6 KB) but am getting some weird result again.
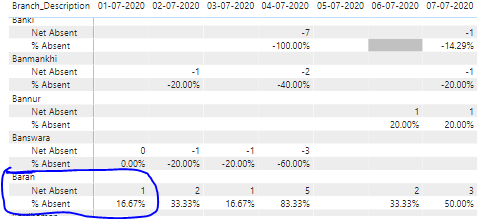
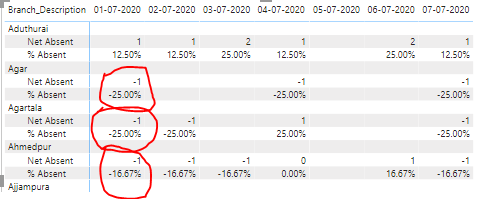
You can see in the below screenshot where for Branch name “Baran” has 2 absent on 01-Jul but these 2 days doesn’t come under regularization or outdoor therefore ideally it should show as 2 absent but it is showing as 1 absent
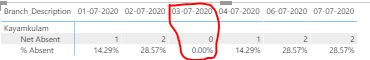
Same issue for one more branch “Kayamkulam” .on 03-Jul absent number doesn’t match according to file
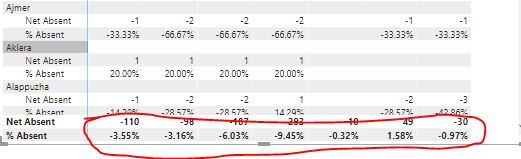
Am not sure why Negative values are coming for few Branches ?
I have attached excel and BI file also, Please assist me if I have calculated something wrongly
@Dharma
Ok, So the problem was that some employes appeared in the total OD/regularization table. But they didn’t appear as absent in the absent data.
The complete solution would depend on your business processes.
I suppose that if an employee does not appear as “A” in the absent table, we can ignore if he/she appears in the OD/regularization table.
This means that we need to add a filter in the Total OD/Regularization measure.
We can include the absent employees with the following measure
Total OD / Regularization =
CALCULATE (
    COUNTROWS ('OD & Regularization'),
    CALCULATETABLE (
        VALUES
            ( Master_Data[Employee_Code] ),
            FILTER ( Absent_Data, Absent_Data[Result] = "A" )
    )
)


 calculated something wrongly