I am working on supply chain dashboard and I am struggling with how to create a measure that will show the supply days, that is, for how many days my ending stock would be enough to cover my demand for. I need this measure to preferably work on different product hierarchies and market level.
A simple example is that if my monthly demand for feb, mar, apr, may was 20, 10, 10, 20 respectively, and at the end of Jan20 my ending stock for product A was 50 units, that means I have enough stocks to cover me for 105 days.
Any help on this would be highly highly appreciated.
Thanks sample.pbix (110.9 KB)
can you pls explain this a little bit further? how did you get 105 days?
“A simple example is that if my monthly demand for feb, mar, apr, may was 20, 10, 10, 20 respectively, and at the end of Jan20 my ending stock for product A was 50 units, that means I have enough stocks to cover me for 105 days.”
also what does the stock measures represent in your pbix file>? and how is the demand represented in your pbix file?
Sure.
Stocks are the ending inventory against the months mentioned.
For the past date, sales are the actual sales, productwise & marketwise, in a particular month. In future dates, sales are represented by forecasted demand.
50 units of product A in mkt A at the end of Jan means I have enough stocks to cover the demand of feb (20 units), march (10 units), april (10 units), but only half of may (10 out of 20 units). that means i m covered for approximately 3.5 months (30*3 + 15)
I have had a look at your question and I have a few more questions to ask you to clarify as there seems to be some data missing.
What is the Category column in the table “Table” represent? (By the way you need to be more explicit with the names of your tables rather than just give it a generic name “Table”. It will just lead to more confusion if you do not label your tables and follow the name convention as stated by Sam in his videos)
Please look at the below screenshot
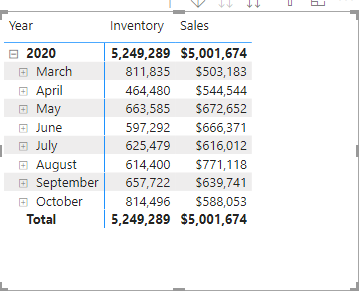
I have visually rearranged the data in a table in 3 separate columns Year , Inventory and Sales.
You mention that the inventory amount each month is closing inventory and you will like to calculate the number of days that inventory will cover demand for the next few months if I am correct. Where do we find the data that shows forecast demand or current demand for those months?
So for example in March 2020, Inventory amount is 811,835, Sales is $503,183. Sales amount is qty times price. We have the sales amount but not the quantity that we need to be able to calculate the measure you are after.
Please clarify if possible so I can see if I can help.
Thanks for posting your question @MAA. To receive a resolution in a timely manner please make sure that you provide all the necessary details on this thread.
Here is a potential list of additional information to include in this thread; demo pbix file, images of the entire scenario you are dealing with, screenshot of the data model, details of how you want to visualize a result, and any other supporting links and details.
Including all of the above will likely enable a quick solution to your question.