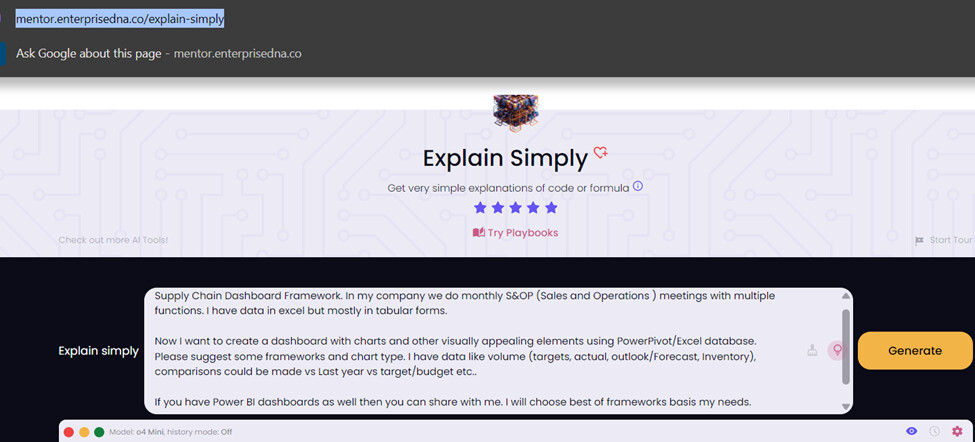
In my company we do monthly S&OP (Sales and Operations ) meetings with multiple functions. I have data in excel but mostly in tabular forms.
Now I want to create a dashboard with charts and other visually appealing elements using PowerPivot/Excel database. Please suggest some frameworks and chart type. I have data like volume (targets, actual, outlook/Forecast, Inventory), comparisons could be made vs Last year vs target/budget etc..
If you have Power BI dashboards as well then you can share with me. I will choose best of frameworks basis my needs.
Thanks in advance. Please do help me in this regards.
While waiting for others in the community to respond, we took the initiative to run your inquiry through Data Mentor’s “Explain Simply” feature. You may also use your free queries to check. https://mentor.enterprisedna.co/explain-simply
Here’s what you can explore based on the initial results: