attached a pbix and an excel with screenshots and explanation
in the pbix
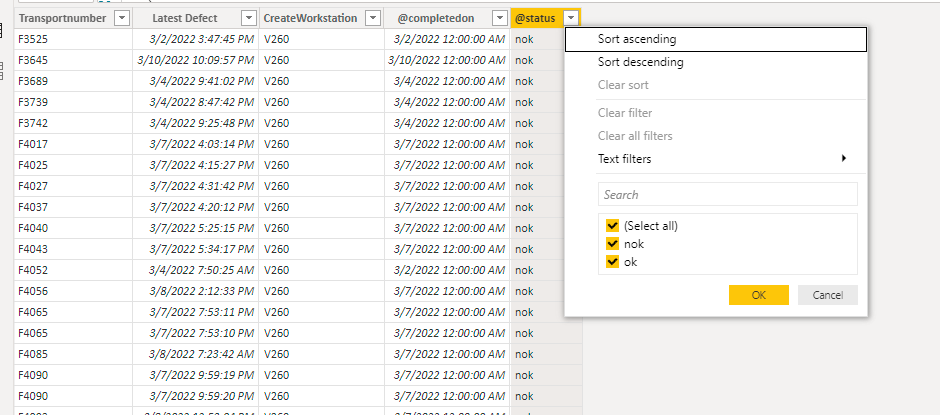
table defects ( has all the defects)
table cabs grouped by workplace an completedon ( grouping by power Q before loading the data )
table defects latest date ( grouping from the defects by max close date )
i made an effort see table to check result V 260 with some comments
thanks in advance
I have attached my solution .
Pls check the pbix and let me know if this what you wanted if not then let me know where i went wrong so i can help you better.
Anurag, many thanks for the pbix,
it’s close to perfection
I added some screen for improving the measure. if this works I can use this pattern for some more measure without creating additional tables
Anurag,
yes that’s it, this should give me the number of tranportnumbers that ar not ok,
I can copy var TB1 and wrapped this in a countrow() for making it a measure to count the defects
the number of tranportnumbers is already a measure "
tranportnumbersV260"
can I use these two measures to calculate the ratio
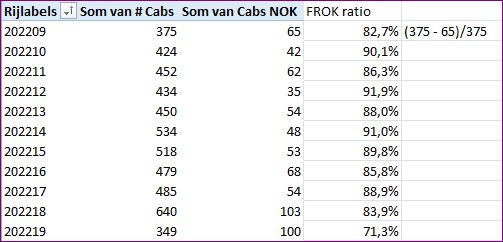
frok v260 = divide( tranportnumbersV260- number of defects), tranportnumbersV260) ?
the screenshot is a excel calvc for the FROK v260 on a weekly basis
Give it a try because i am not able to get you above so give it try if it does not give you desired number let me know here then we can figure what is not going right.
Some more info
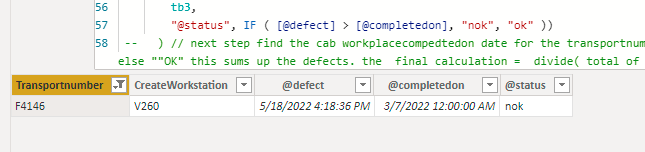
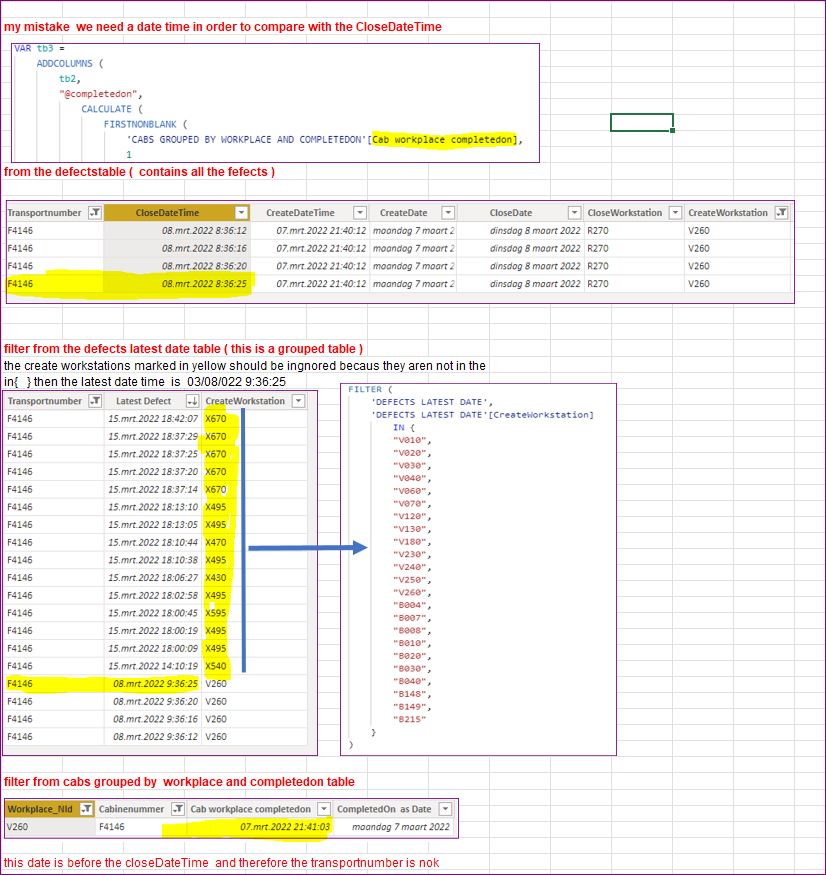
I made a mistake in giving you the wrong datefield
if it’s easier to use the complete defects table then let me know.
thanks in advance
Roger
hello
Attached the pbix i made some changes on the dates
used the closeDT+ 1 hr,
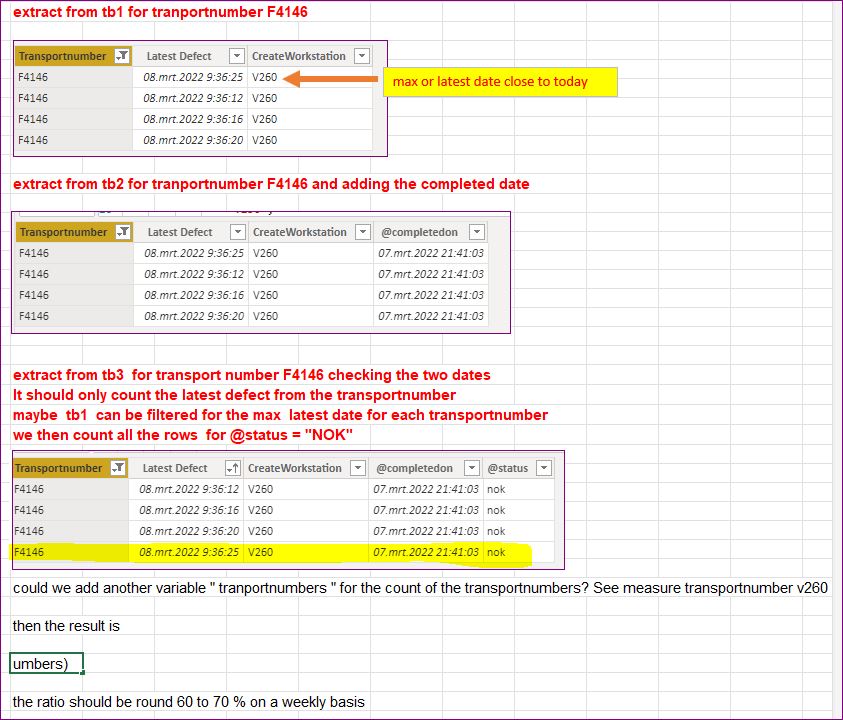
var TB2 should be be filtered on workplace_Nld = V260 = dd 3/7/21:41:03
if you filter the table for cabine number 4146
there are 4 records left i need only one preferable for the closeDT 3/8/22 9:36:20 else the defect are counted 4 and I need only 1
thanks