Hoping to get help with the following issue:
I want a measure that creates virtual table to return all products and customer ids in the first two columns (ignore any slicers) and then take Current year units measure and prior year units measure (based on date slicer on dashboard) and the last column subtracts the two measures. The result is a sumx on the subtracted column.
I know the simple solution is to just use calculate but given this is part of a bigger measure I’m working on, it needs to be done using sumx and summarize as I need to perform a computation on every row of the virtual customer-product pair.
The issue I’m facing is that if a user selects a fiscal year 2017 (current year) as a slicer, the product and customers showing in the virtual table are only 2017. Hence if there were units in 2016 and not in 2017 it will ignore this and I don’t want it to. It should show all products and customers and then use the filter context to get current year (2017) units and prior year (2016) units for each product customer grouping. Then subtract the two columns on a row level and finally add the final result. Help is much appreciated.
Please see attached file for more details on the issue.
Summarize Sumx Help.pbix (383.7 KB)
Thanks!
Can you possibly place more information into the forum thread about the issue. I want to prevent just placing details into a file as that doesn’t really help anyone if they land on this issue later on.
Thanks
Thanks Sam. I’ve updated my initial post to make it more detailed. Help is much appreciated.
@avalon.ds,
I took a look at this and here’s what I came up with.
VAR __SummarizedTable=
	SUMMARIZE(
		Sales_data,
		Date_Data[Fin Year],
		Product_Data[Product ID],
		Customer_Data[Customer ID]
	)


Var __AddColumns =
	ADDCOLUMNS(
		__SummarizedTable,
		"Total Quanity", CALCULATE( SUM( Sales_data[Quantity] )),
		"Prior Year", CALCULATE( MAX( Date_Data[Fin Year]) - 1)
	)

Var __PriorYearQty=
	ADDCOLUMNS(
		__AddColumns,
		"Prior Year Qty",
		CALCULATE(
			SUM( Sales_data[Quantity]),
			FILTER(
				Sales_data,
				 Product_Data[Product ID]= CALCULATE( MAX( Product_Data[Product ID] ))
				 && Customer_Data[Customer ID] = CALCULATE( MAX ( Customer_Data[Customer ID]))
				 && Date_Data[Fin Year] = CALCULATE( MAX( Date_Data[Fin Year]) +1 )
			)
		)
	)
RETURN

__PriorYearQty
I broke it down into variables to help keep it clearer. But basically we start with your summarized sales table by Year, Prod ID and Customer ID.
Then we use AddColumns on that table. We want to use AddColumns here and wrap the function in calculate to force context transition.
Then to get the Prior Year Qty we use another AddColumns Function. Same premise as above as we want to force context transition.
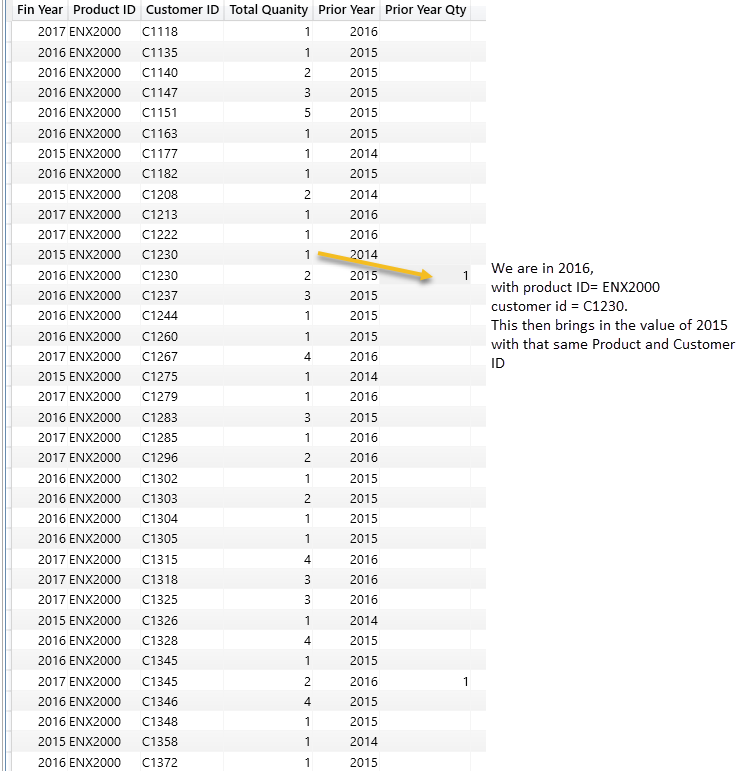
And here’s the final table output.
Hope that helps
Nick

Thanks for the reply and help Nick. For some reason the solution didn’t work for me and the output didn’t show any result.
I found a solution that does work. See below
Measure =
SUMX (
SUMMARIZE (
CALCULATETABLE (
GENERATE (
VALUES ( Customer_Data[Customer ID] ),
VALUES ( Product_Data[Product ID] )
),
ALL ( Date_Data )
),
[Customer ID],
[Product ID],
“YOY_Units”, CALCULATE ( [CurrentYear_Units] - [PriorYear_Units] )
),
[YOY_Units]
)
@avalon.ds,
Glad you found a solution. The code above was to show how to build the virtual table. The output you saw was the query output from Dax Studio.
Nick