Summarising a sales table - 1st, 2nd, 3rd salesperson?

Hey,
I’m clearly missing something simple here, and aplogies for not being able to find this myself.

We have a main sales table where every row is a single transaction, associated with a salesperson (and the date, etc).
I want to create a summary table now with every unique customer, and then the first column shows the salesperson who had the highest count of sales (not sum) for that customer, next column is the person with the second most sales, etc.
Can someone point me in the right direction here?

@rodwhiteley,

Here’s how I would handle this using RANKX:

  1. Create a measure using RANKX, where you’re ranking based on a simple count of total sales measure

  2. Create a second measure, starting with a table variable
    VAR vTable =
    ADDCOLUMNS(
    VALUES( Salesperson column),
    “NumSales”, [Count of Total Sales Measure],
    “SalesRank”, [RankX Measure above]
    )

RETURN
CALCULATE(
SELECTEDVALUE(Salesperson Column),
FILTER(
vTable,
[SalesRank] = 1
))

  1. Just replicate this exact same measure two more times, changing the filter condition to
    [SalesRank]=2, and then equal to 3 in the final measure.

If this is not sufficiently clear, please just post your PBIX file and I can work through the specific DAX with you. Here are some great videos that walk through the RANKX function in detail:

I hope this is helpful. Just give a shout if you have any additional questions.

  • Brian
2 Likes

Hi @rodwhiteley, A response on this post has been tagged as “Solution”. If you have a follow question or concern related to this topic, please remove the Solution tag first by clicking the three dots beside Reply and then untick the check box. Thanks!

Sorry - it’s taken longer than expected - the performance of RANKX has been so slow that writing this has been difficult to figure out what I’m doing wrong.
My transactions table has 300,000 rows, and the customer list has 11,000 rows which doesn’t seem that much, but updating the table to debug is taking about 5-10 minutes every time I click. I still haven’t got the RANKX working as expected
Edit: the performance issue was resolved as follows.
I have a dimension table with a customer ID number. The main transactions table has this customer ID, and the full patient name. When I placed the Custromer ID, Total Transactions measure, and the RANKX measure in the table, it’s quick to refresh. If I also pull across the customer name from the Transactions table, it’s about 5-10 minutes for any refresh.

The measure is returning a blank, so I’m misunderstanding something here.
image
Some background information - the model is pretty simple - but a clarification, we are a hospital, so instead of salespeople, we have therapists, and instead of sales, we have appointments. Each row in the fAppointments table is an appointment by a patient, these have 3 states “Is Check In”, “Is Canceled”, or “Is No Show” which are mutually exclusive (values in these cells are 1 or null), so the sum of these is the [Total appointments] measure ([Total Check Ins] + [Total Cancels] + [Total No Shows]) and is the measure I care about for this purpose.
Each patient’s unique identifier is their Medical Record Number, so the dMRN List table is the patient dimension table, and the dTherapists table is the therapist table:


The Ranking measure seems to be working fine:
image
But I’ve likely done something wrong here I guess:

Thanks again for any help,
Rod

Hi @rodwhiteley,

Please check this Blog post by Sam, midway it demonstrates ranking with virtual tables.

Give this a try, if you need further assistance please provide a sample PBIX - thanks.
I hope this is helpful.

Thanks. Unfortunately I can’t share the pbix as it has medical information in it which is against the law here to share :frowning:

I’ve made up some simplified dummy data and tried to replicate the formulae above, as well as making an excel solution as a check.
I made up 50 random patient names, and 5 random therapists, from these I have made 10,000 random appointments back to 1 january 2019, in the same format we record our data, more or less (Check IN, or Cancel, or No Show, 1 or null, mutually exclusive).

The excel workbook has the result I want (except it doesn’t handle ties properly) which looks like this:


(The conditionally formatted cells are the count of total appointments for the patient and therapist intersection)

The DAX equivalent is not behaving itself:


Here’s the model:

And here’s the formula for the Rank(1):

And here’s the Ranking formula:

Dummy Therapist Ranking.pbix (97.3 KB)
I’ve uploaded the .pbix and the Excel Source file[AppointmentSource.xlsx|attachment]
And as always, appreciate any and all help,
Thanks,
Rod
AppointmentSource.xlsx (333.3 KB)

1 Like

@rodwhiteley,

Wow, awesome explanation of the problem. Thanks very much for putting all this together - makes providing a good, specific solution much easier.

You’re definitely on the right track here, but the construct is a little different than what I envisioned from your initial post. Let me rework this a bit and get back to you later today.

  • Brian
1 Like

@rodwhiteley and @pshetty,

Just wanted to let you know that I’m still working the responses I owe you. Crashing on a work deadline and didn’t get the expected time to work on these last night. Sorry for the delay- will get back to you soon.

  • Brian
2 Likes

@rodwhiteley,

This one’s proving tougher to crack than expected. Spent a good chunk of time on it tonight, but still have a bug to fix. Need to call it a night and look at it with fresh eyes tomorrow.

  • Brian
1 Like

I fell bad that you’re spending time on this, but also kind of pleased I couldn’t figure it out myself :blush:

@rodwhiteley,

I love a good DAX challenge. I’m the one who was feeling bad about the delay in getting you a solution…

  • Brian

@rodwhiteley,

Okay, I think I finally got this one. Number of challenging elements here:

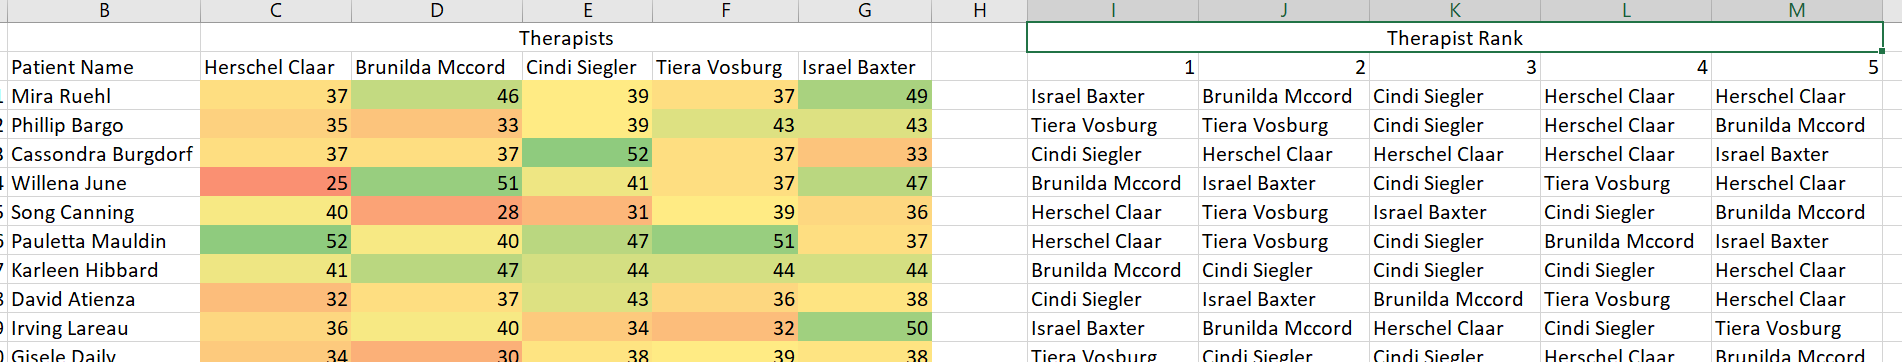
  • overriding the patient evaluation context in the matrix (i.e., getting RANKX to rank based on therapist rather than patient, but using patient to filter the fAppointment table down to the proper records to summarize)
  • dealing with the large number of ties
  • checking the evaluation context for HASONEVALUE (otherwise the measure will always return the therapist with the highest total number of patient visits overall)

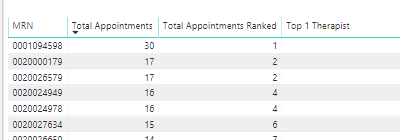
Two basic measures here (though the second one is repeated five times changing the rank criteria from 1 to 5 to form the matrix values/columns). The first is just a standard RANKX, ranking therapists by total appointments:

RANKXTherapist = 

RANKX(
        ALL( fAppointments[Therapist] ),
        [Total Appointments],
        , DESC,
        Skip
)

The second one does the heavy lifting, creating a virtual table that overrides the matrix evaluation context for the ranking, handles ties through the alternate condition in SELECTEDVALUE, and does the HASONEVALUE trapping at the end:

Therapist Rank #1 = 

VAR SelPatient = SELECTEDVALUE( fAppointments[Patient] )

VAR vTable =
CALCULATETABLE(
    ADDCOLUMNS(
        SUMMARIZE(
            fAppointments,
            fAppointments[Therapist]
        ),
        "TotAppt", [Total Appointments],
        "TherRank", [RANKXTherapist]
    ),
    FILTER(
        fAppointments,
        fAppointments[Patient] = SelPatient
    )
)

VAR TherAtRank =
CALCULATE(
    SELECTEDVALUE(
        fAppointments[Therapist],
        "Tie"
    ),
    FILTER(
        vTable,
        [TherRank] = 1
    )
)

RETURN
IF(
    HASONEVALUE( fAppointments[Patient] ),
    TherAtRank,
    BLANK()
)

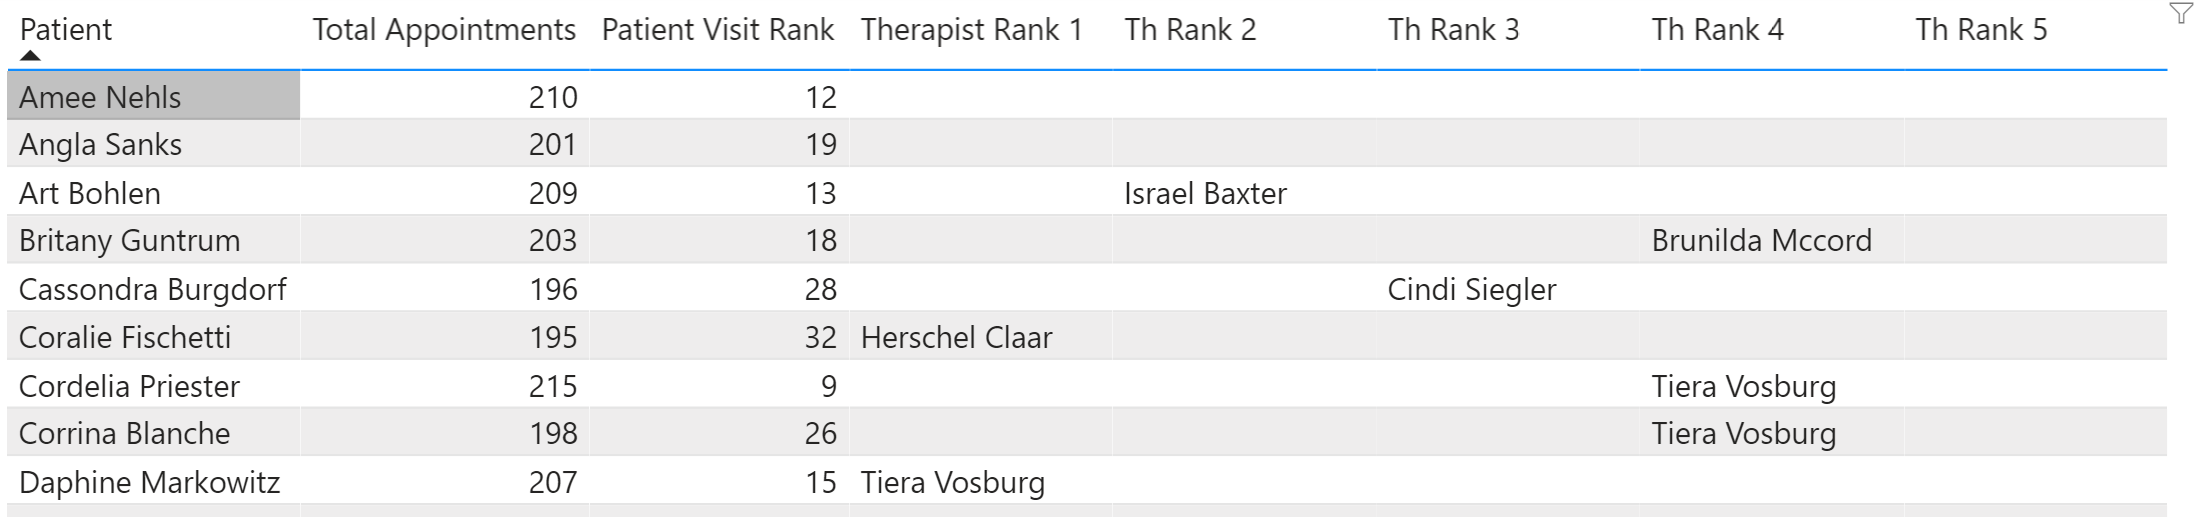
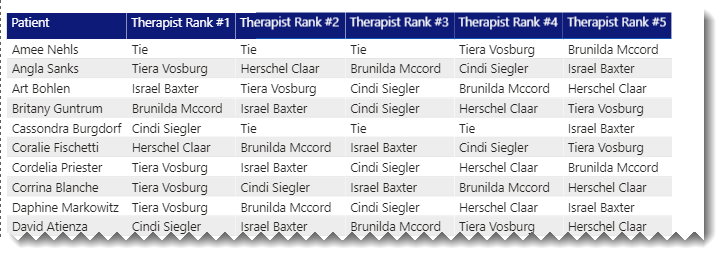
Here’s what it looks like all put together:


I think this gets you what you were looking for, but given the frequency of ties, you may want to consider a secondary criteria to use as a tiebreaker.

I hope this is helpful. Full solution file posted below.

P.S. @pshetty - you are up next. Between a really busy work week, and this one taking longer to crack than I expected, I’m behind on your solution, but will get to it later today. Thanks for being patient, sorry for the delay.

5 Likes

Thanks for your work on this Brian - this works fine for my real data where there are few ties. I really appreciate the time you put in with this.

I don’t know if this is going to be a useful technique for others, but would there be a way to resolve ties by a second criteria perhaps? Maybe Alphabetical sort on the therapist name would be simplest as it would never be a tie like some other secondary criteria might be

@rodwhiteley,

Great – glad to hear that’s going to work well for you. There are a number of techniques that can be used for breaking ties. I’m actually working on putting together some training materials on that very topic. You can use a secondary criteria, or if there are truly no differences between the tied elements, you can just add a tiny random component to the value being ranked to ensure no ties.

  • Brian

@rodwhiteley,

“I don’t know if this is going to be a useful technique for others, but would there be a way to resolve ties by a second criteria perhaps?”

Wow, you were really prescient on this one. Look what question popped up today:

  • Brian
1 Like

Actually This may come handy for my another issue. Thank You :slight_smile:

Ruth has a nice video of basically this solution here: https://www.youtube.com/watch?v=WzpqBLApSBU