Currently displaying the open 90 day pipeline total based on Est Closure date using a relative date filter on the page. This was fine in the beginning as the 90 day pipeline was independent of all other data so a page level filter was no problem. We’re expanding the data being pulled in and the comparisons we want to make. What I need to do now is house the date filtering within my measure to limit it to the next 90 days. I have a date table that spans from 1/1/2016 - 12/31/2018 linked on the Est Close. Current measure is as follows:
Test =
VAR MinDate =
    MIN ( Pipeline[Est Close] )
RETURN
    IF (
        MinDate < TODAY (),
        BLANK (),
        CALCULATE ( [Total Open Pipeline $], DATEADD ( Dates[Date], +90, DAY ) )
    )
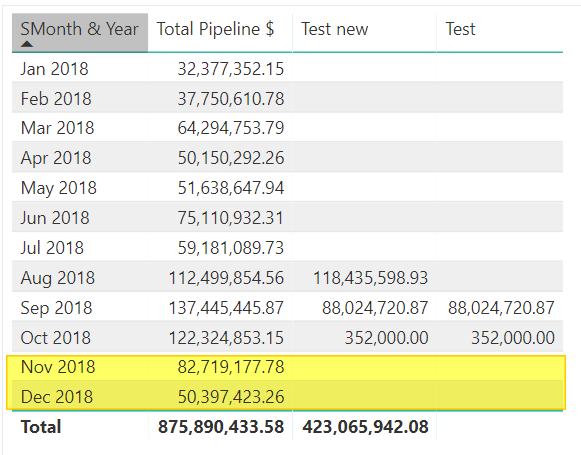
This gives the correct results in a table, however, there is no total. Which means I cannot display the value on a card. What am I missing?
Thats the goal, show the total value of the next 90 days, based on the Est Close Date. I got the total to show now, I had MIN and needed MAX, New measure as follows
Test new =
VAR varDate = MAX ( Dates[Date] )
VAR varValue = CALCULATE( [Total Open Pipeline $], DATEADD( Dates[Date], +90, DAY ) )
RETURN
    IF (
        varDate < TODAY (),
        BLANK (),
        varValue )
This is better as my other was missing Aug 2018 data. Both are missing Nov data, which would apply as 90 days from today would bring us to November.
Heres a sample file. I have a date table linked on Est Close Date. My Date Table spans 1/1/2016 - 12/31/2018 EDNA Sample.xlsx (19.8 KB)
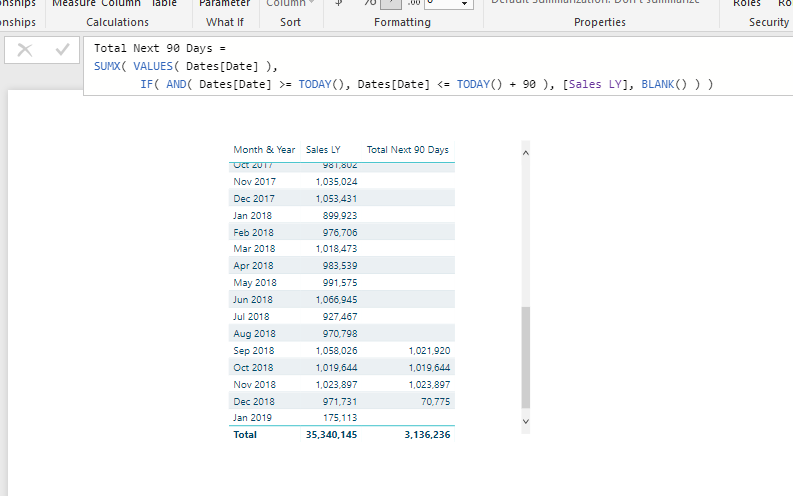
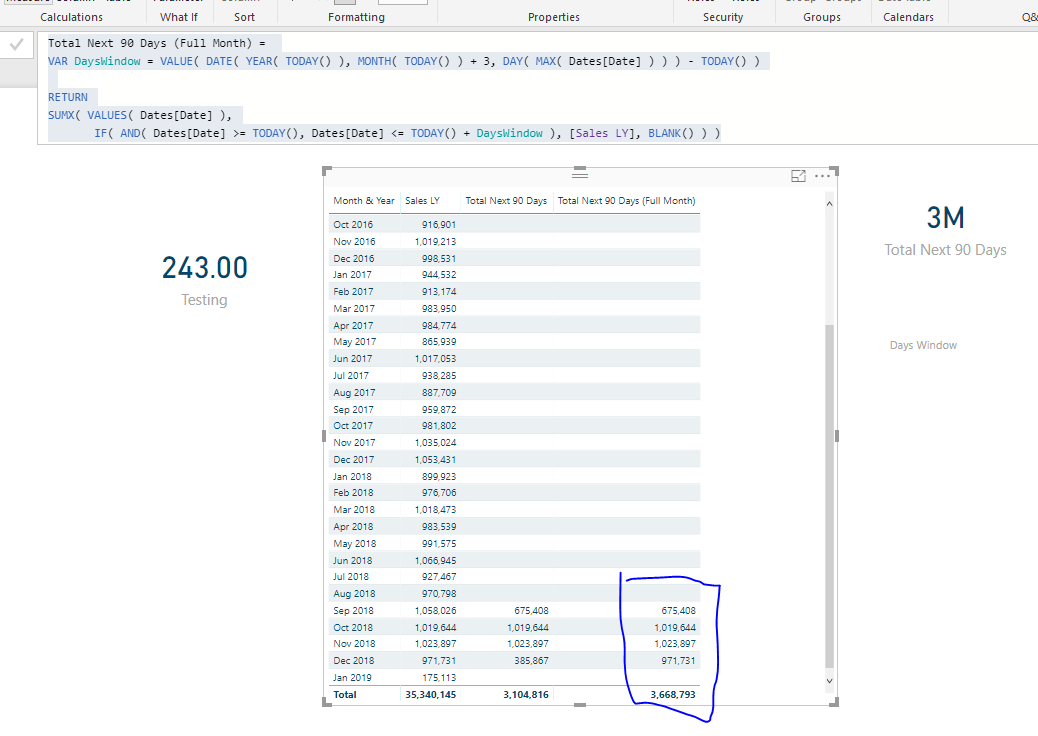
Branching off of this, what if I am looking to see the same type of info based on next 3 months as opposed to 90 Days? Using the patterns we have here, I can go into Dec but don’t get the full month, which makes sense as it would be outside the 90 Day threshold. But what if we wanted to see through to the end of the last full month (in this case December)?
That works! Trying to understand the variable here, can you tell me if I am interpreting this correctly? Essentially returning a date based on todays date, pulling in the current year, the month +3, and the day by going to the MAX date in the month +3 definition. We are then taking that date and subtracting today to give the time between today and the desired end date.
Our measure is then just looking for date >= today and <= Today + Variable