Good day.
After going through the Financial Statements course, I am building my own statement.
In this example I want a statement that helps me calculate and report on the produce sold.
I have:
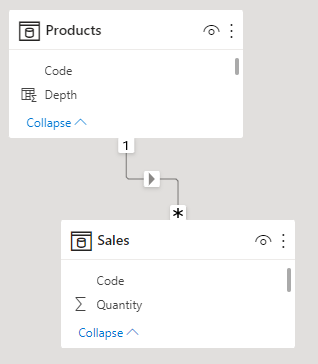
- A measure table
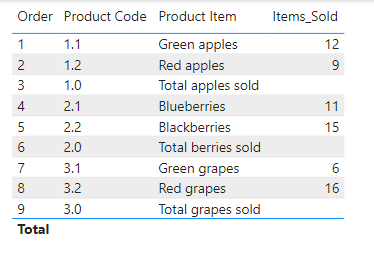
- A sales data table
- A report template
The above are attached.
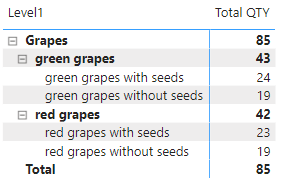
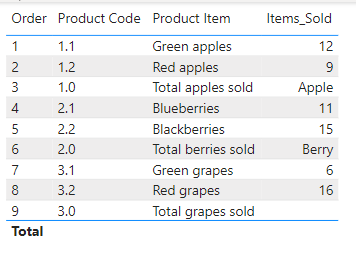
I would like to have line times that show how many of each type of produce
Produce_Report_Sample.pbix (36.6 KB)
Sales_Data.xlsx (9.2 KB)
Template.xlsx (9.6 KB)
is sold and line items that subtotal and total rows that sums up all the types of produce.
I have made an attempt, but my subtotals in my template return no value. The DAX for the subtotals works as I have set up card visual to show the total by type of produce is returning a value.
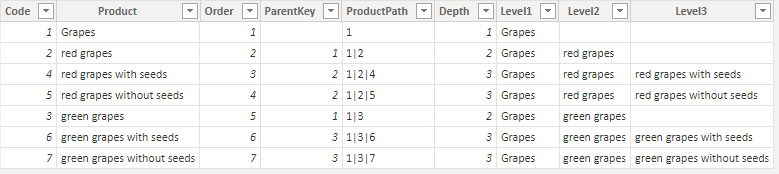
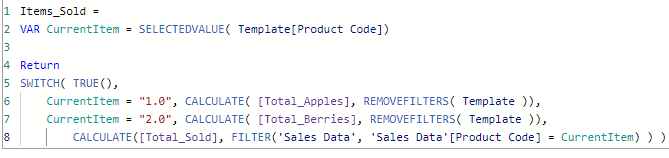
My goal is to have the template leverage a format for the Product Code from the Sales table with an implied hierarchy so that as I parse the Product Code in the DAX it allows me to calculate and display subtotals in the template.
For example:
Product Code
3. = Grapes
3.1 = green grapes
3.2 = red grapes
3.1.1 = green grapes with seeds
3.1.2 = green grapes without seeds
3.2.1 = red grapes with seeds
3.2.2 = red grapes without seeds
The desired effect would be that I could parse portions of the Product Code using LEFT() to derive my subtotals and totals in the template.
If the SELECTEDVALUE is
Left(Products Code,2) = “3.” would apply to all grapes.
Left(Product Code, 3) = “3.1” would apply to all green grapes (seeded and non seeded)
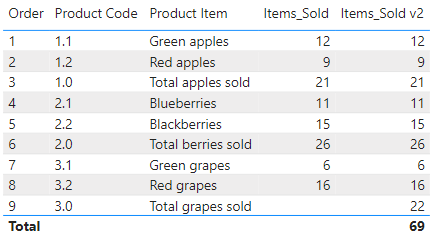
In the example I have built, I am able to get the line items to present properly.
My subtotals do not show.
I put my total measures on cards to test that they are calculating properly.
Thank you in advance for any guidance.