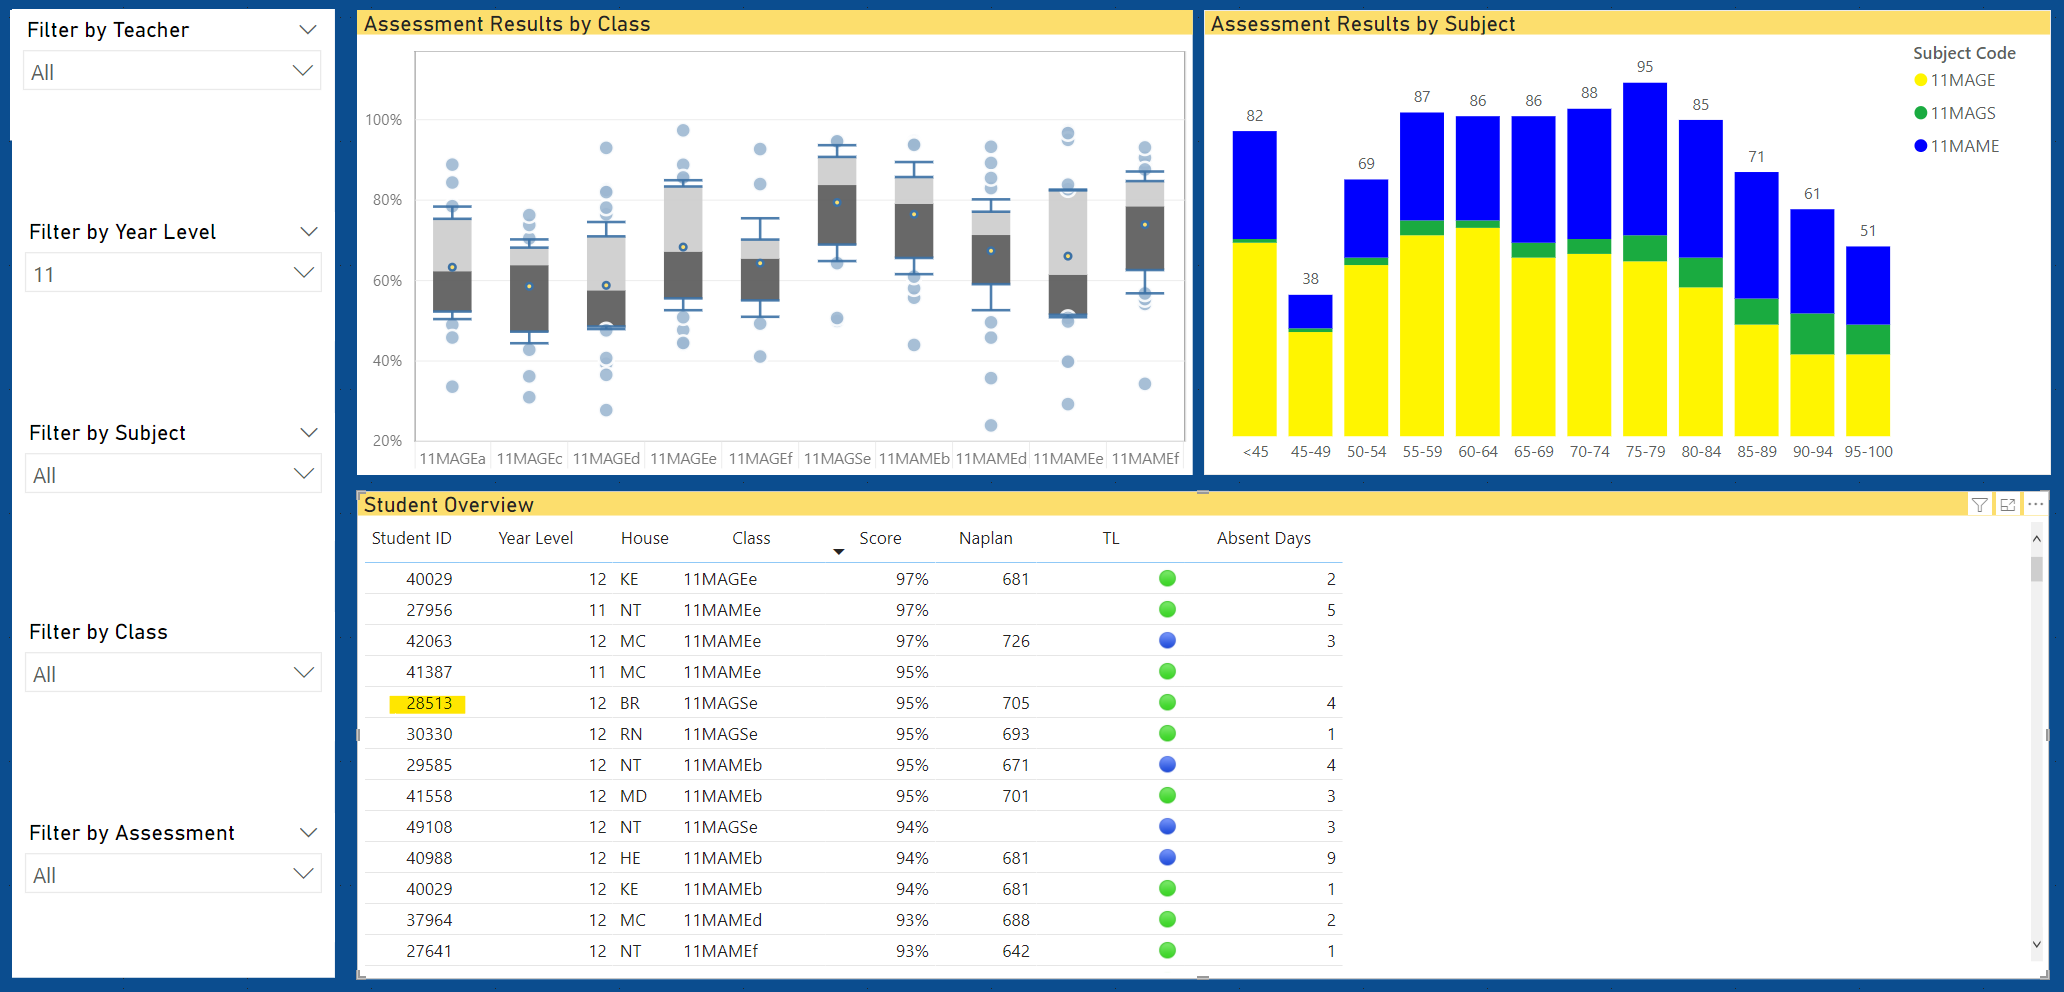
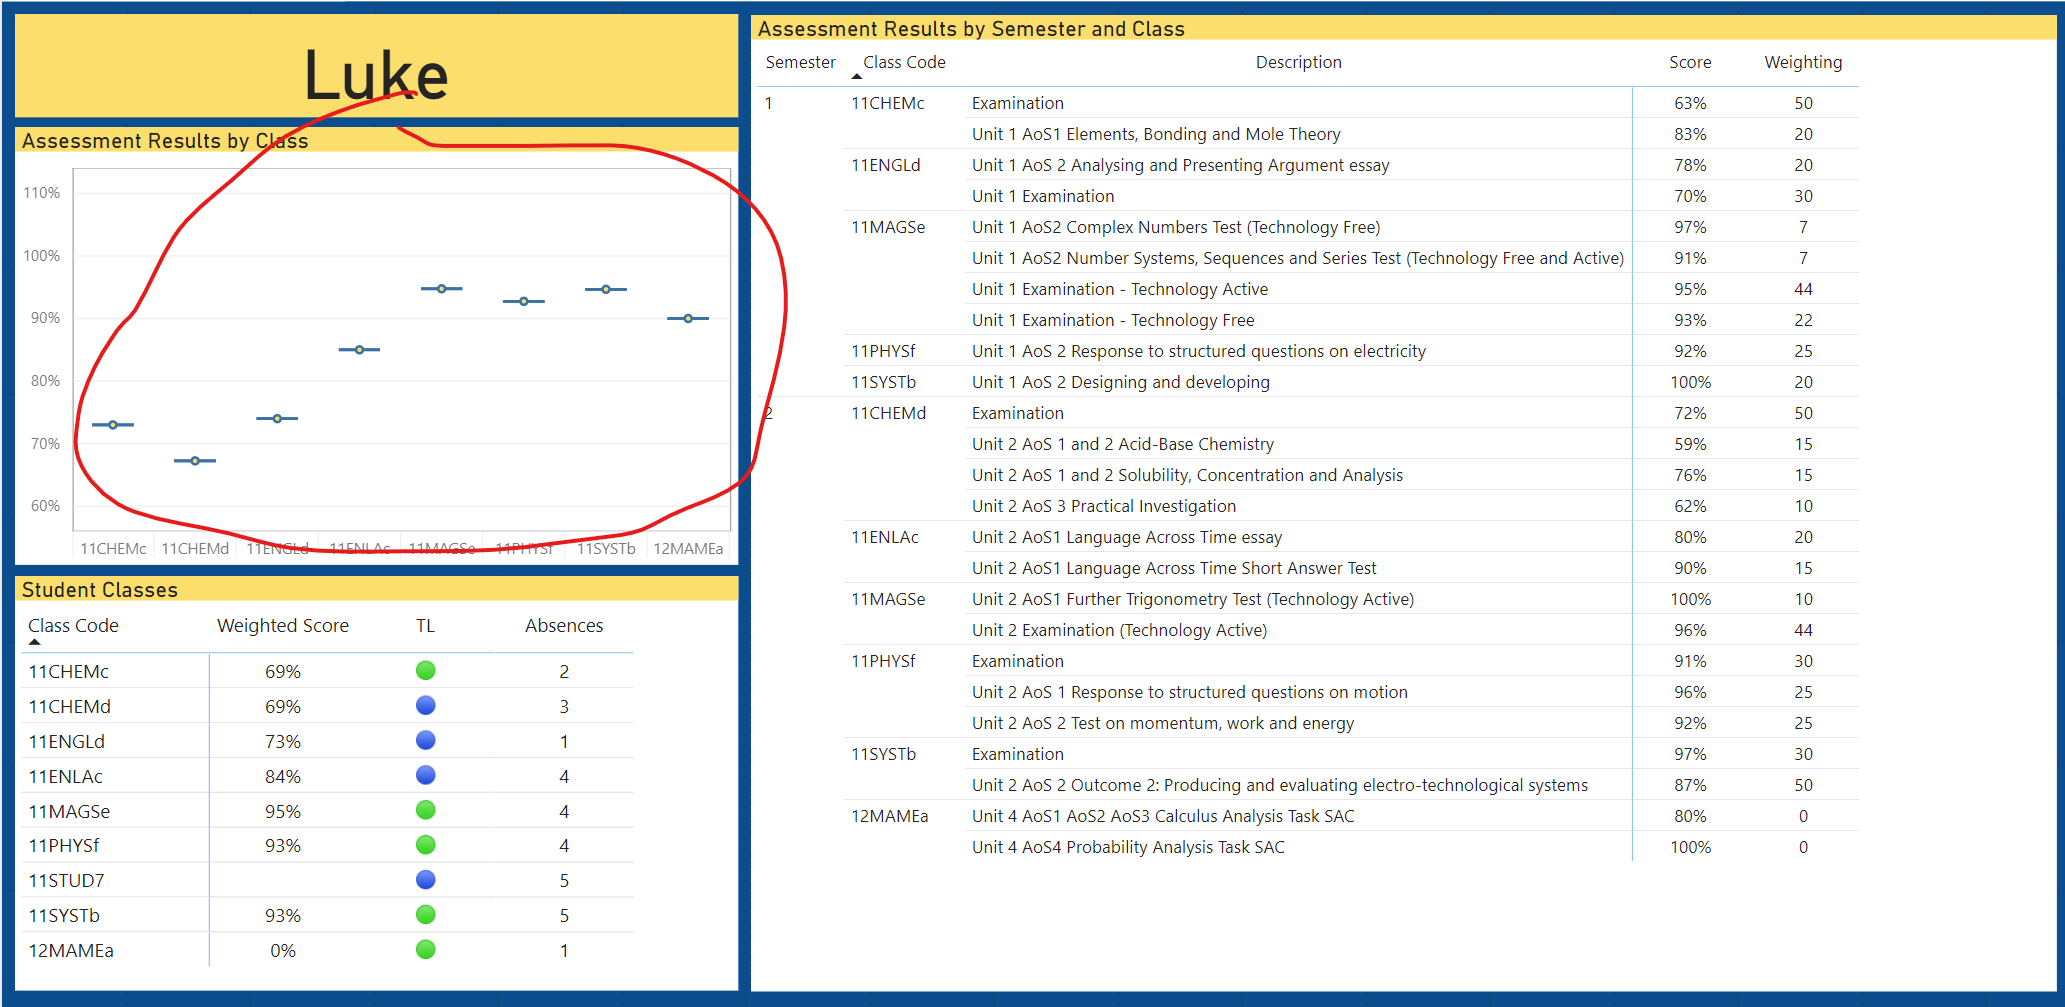
What I am trying to achieve is this; when the teacher selects a student from the list on the Teachers page and drills through to the students overview, they should see ALL the students classes and a boxplot showing each classes scores. However, when you drill through and filter the Student page to that student, the boxplot is filtered to only that student and not the entire class.
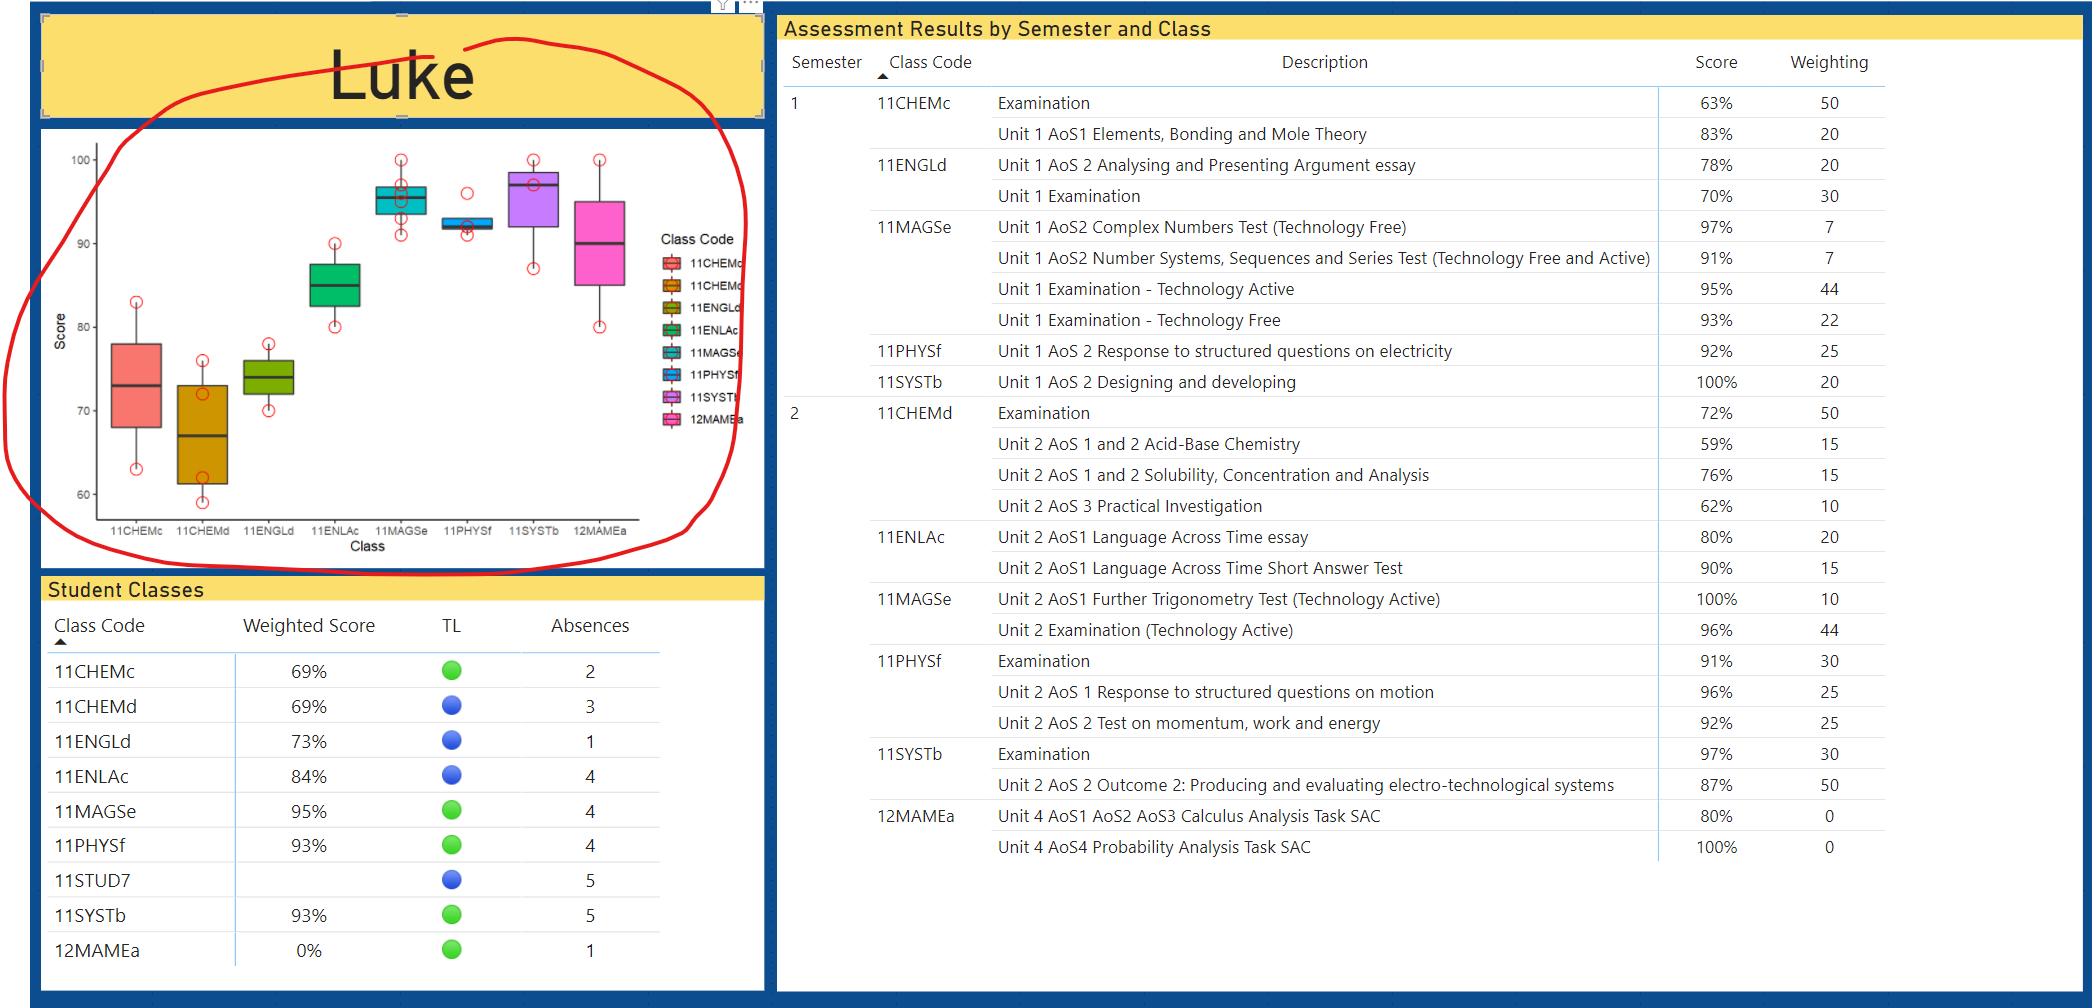
The visual I’m using is MAQ Box and Whisker chart. The example of Desired Output is one I did using R but does not have the hover capabilities I need so I’d rather use the MAQ one. I’m hoping this is a DAX fix in the AVG Assessment Results measure. My R skills are not up to it ‘yet’…
Bumping this post for more visibility. While waiting for other members to jump in, I suggest using the forum search to discover if your query has been asked before by another member. Thanks!
You mentioned “There are two pages in this report.” , but they seem not to be in attached PBIX , could you send a PBIX including the two pages as pictured above ? Are those set up with a drill through or two independent reports ?
Could you clarify how “Assessment Results” is calculated (could not find it in attached PBIX) ?
You suggest “I’m hoping this is a DAX fix in the AVG Assessment Results measure.” Where to find the measure and what is it supposed to do ?
Apologies for having not provided a better example pbix.
I have attached an updated version of the report with both the Teacher and Student Overview pages. The drill through is configured on the Student Overview page. We want to be able to select a Student ID in the Students Overview visual on the teachers page and drill through to that students detail for all their classes.
All measures used are in the Assessment Measures table. Boxplot Example.pbix (1.1 MB)
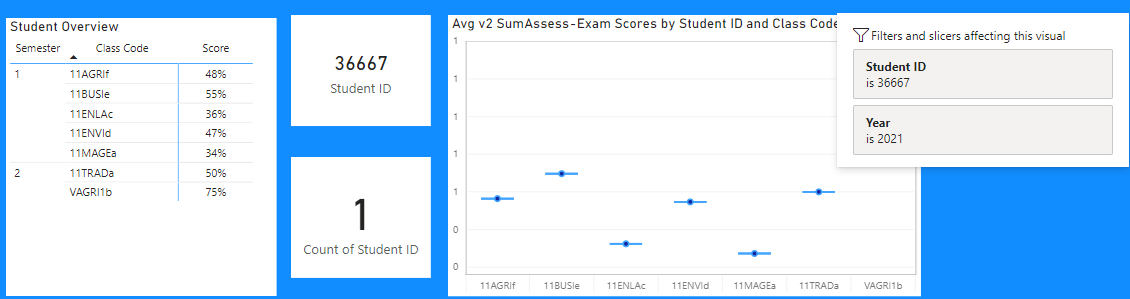
Your question : a report with the scores of all students. limited by the classes studied by one student, on a drill through page of that single particular student.
Problem is hereby the filtering on a single Student ID, which restricts the content, regardless the measure setup for the visuals.
As you have noticed, all measures keeps being restricted by the filter (Student ID), also when using for example “removefilters”, like below,
Avg v2 SumAssess-Exam Scores =  //NO SOLUTION
Var AllStudents = CALCULATETABLE(values('Assessment Results'[Student ID]),REMOVEFILTERS('Assessment Results'[Student ID]))  // not working, still depends on outside-filter Student ID
Var AverageCalc = AVERAGEX(
         AllStudents,
         //VALUES( 'Assessment Results'[Student ID] ),
        CALCULATE(
            AVERAGE( 'Assessment Results'[Normalised Mark] ),
                FILTER('Assessment Results', 'Assessment Results'[Work Type ID] IN { 1, 13 } ),
                REMOVEFILTERS(Students[Student ID]), removefilters('Assessment Results'[Normalised Mark]), REMOVEFILTERS('Assessment Results'[Work Type ID])
        ) * .01)
Var CountAllStudents = COUNTROWS(AllStudents)  //remains 1
Return AverageCalc
Even when not using a drill through, the single Student ID is needed to determine which set of classes needs to be selected, and this acts as a filter and will limit the student results to the selected Student.
What is needed is a dynamic input variable “Student ID”, which does not act as a filter, a listing of classes followed by that student ID, and an output of all student-results for those classes.
I have not found a solution . . . . .
It’s great to know that you are making progress with your query @mkaess.
Please don’t forget if your question has been answered within the forum it is important to mark your thread as ‘solved’.
We request you to kindly take time to answer the Enterprise DNA Forum User Experience Survey, We hope you’ll give your insights on how we can further improve the Support forum. Thanks!
Hi @mkaess, due to inactivity, a response on this post has been tagged as “Solution”. If you have a follow question or concern related to this topic, please remove the Solution tag first by clicking the three dots beside Reply and then untick the check box.