Hello everyone,
I am a new member of this fantastic channel/company.
I am having some issues to finalize my “time-based” cohort analysis. I have watched all the videos that Sam showcased on the platform but maybe my dataset looks like a bit different here.
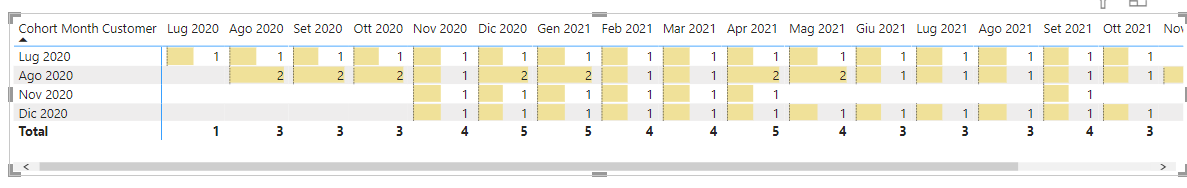
Essentially I do not know how to group the customers by their monthly cohort and create the final matrix that shows me how many customers in a specific cohort came back and purchased again in the subsequent period.
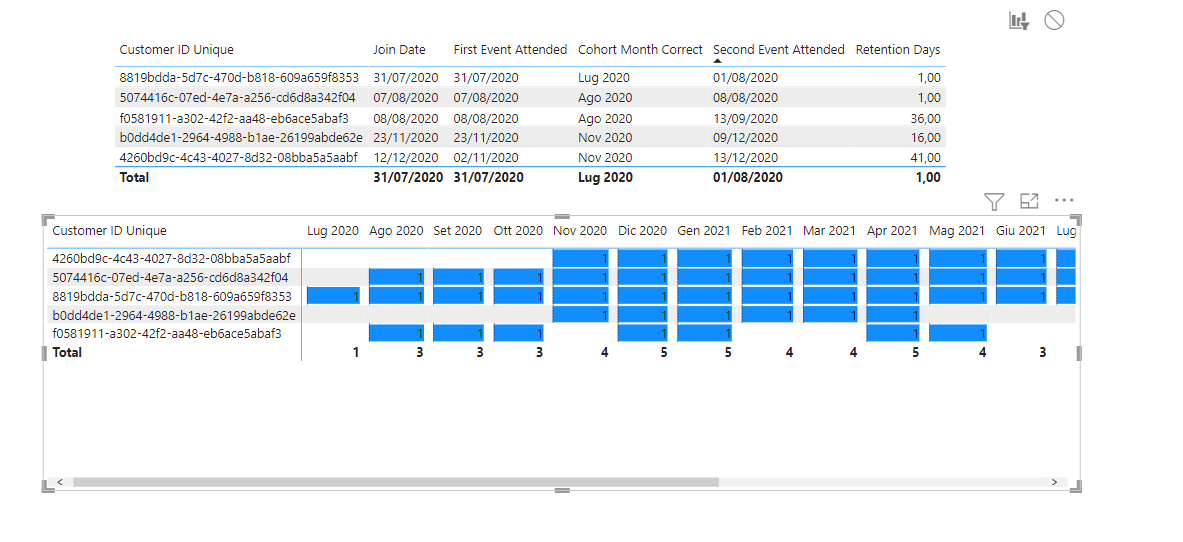
I have managed to create a cohort analysis at the customer level: so I know if my customers came back and purchased again month on month but I want to aggregate those customers by month Table_Events.csv (3.2 MB) Cohort PowerBI.pbix (180.1 KB)
In this data set, there are only 4 customers joining in 4 different months (Jul, Aug, Nov e Dec 2020).
I achieved this result by:
List item
putting in rows the monthly cohort using a measure (this works fine)
showing the subsequent months adding in columns the Month & Year Column from the extended dates table
adding the unique customer measure in the value field in the matrix
I would like to get the same result using a measure also because I need to calculate the % of retained customers and churned customers as well.
Btw, I work as a Senior FP&A Analyst for a SaaS start-up and I am trying to implement Power BI reports and dashboards since it is a way more superior tool than Excel