One of the best ways to improve your report design is to carefully storyboard it out before trying to build it in Power BI. In some of his videos about report design, I’ve seen @sam.mckay sketch his reports by hand on an electronic whiteboard, which is a quick and easy way to do this. However, for those of us who can’t draw or don’t have that same whiteboard capability, templates are really helpful. Powerpoint used to have a nice storyboarding add-in that worked well for this, until they depracated it last year.
However, they recently released this terrific “sketch” template that is absolutely perfect for storyboarding Power BI reports. I’ve attached the PPTX file below via Google Drive (it’s too big to upload to the forum), and here’s a blog article and a video link on how to use it:
I just saw the below video from the Curbal channel, and was getting ready to add this
I use something similar to this (an Excel addin), and it really does make the design process much easier.
The video above that @BrianJ has linked to is the Microsoft info, Ruth’s video digs into how she would use this tool to collaborate with remote team members.
Definitely worth taking a look at. Even if you don’t have the sketch capability in PowerPoint (using an older model), the techniques discussed are still good for design planning.
I’m a big fan of Ruth’s videos, but found this one really confusing. In it, she shows Power BI icons and graphics within the wireframe template, but they’re not there. I posted a question and a follow-up question on her YouTube channel, and still came away confused. If you or anybody else figures out how to get the Power BI visual icons into the sketch template from a screenshot, please post it here, since I couldn’t figure it out.
Looking at the icons she used, they are from the older format (not the new icons we’ve had for a few months now). I’m wondering if she has those from one of her training courses.
My solution on how to get the icons into the template would be to use a tool like snipit, and just ‘clip’ the image from PowerBi onto a clipboard, then copy into the template.
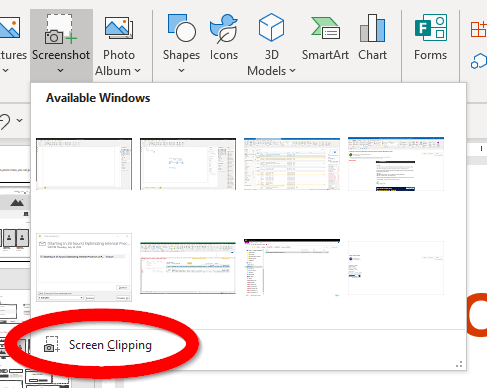
I was actually playing around with it using the Screen Clipping tool from PowerPoint (on the Insert tab of the ribbon):
The only problem with this is I don’t get good resolution on the images, so they pixilate as they are enlarged.
I’m searching now to see if MS has a good screenshot of the current icons that I can grab and manipulate. Will let you know. If I find a solution, perhaps we can add to your template for everyone.
I saw this excellent idea yesterday as well (I think on a Curbal video) demonstrated with Power BI sample shapes but after downloading I couldn’t find any Power BI shapes … I’m going to do more research on the weekend and will hopefully be able to upload some more useful shapes. Greg
Glad to help - that’s what comes of getting to where I am by way of being a ‘does it all’ admin.
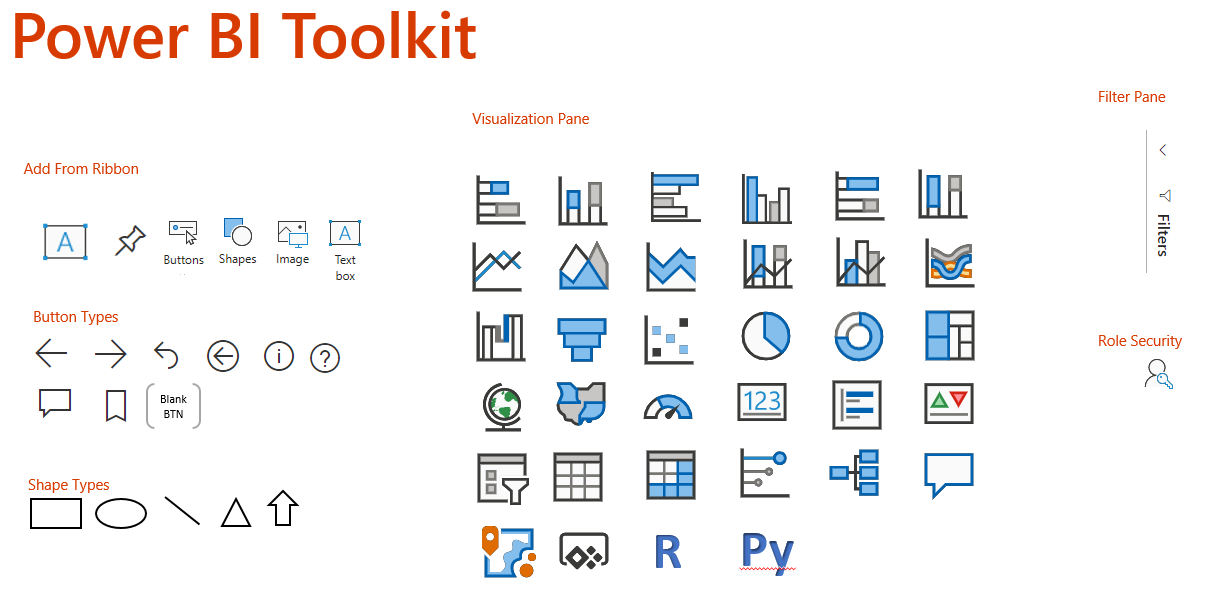
There are a couple of visuals missing - Azure Maps, and the shape map, but I think we can get around that for now.
In case anyone is curious - I opened up one of my reports in the service, blew up the resolution on the browser to 300%, and then clipped each image separately using Greenshot (a screen clip program)
Then I copied the images over to powerpoint and made the grey background transparent.
@BrianJ@Heather Wireframing and dashboard prototype building is indeed a very important step in the BI implementation process. I am using this tool called mokkup currently https://mokkup.ai/) and it is the best tool for dashboard mock ups. Also @BrianJ , the template library is quite extensive. Do check it out and let me know how you like the product.
Yep, the Mokkup looks really awesome. Actually, I used before the whiteboard tools, such as Miro, Mural or Canva. Cause, they have enough universal templates there, suitable to edit and format promptly to fit to any needs. But they are not so specific and not so suitable for visualizing data. For BI development the Mokkup looks rather saving time. Thanks for the recommendation!
From my side I’d like to share also some tips abt how to make a storyboard with a simple storyboard template there. I saved it as hands-on and maybe it would be helpful also. Especially, for those who work with a challenges, like animated presentations or with video storytelling.
I used to create video presentation explaining some data with an animation soft. It was a rocket since for me. May be it would we useful for you also.