I need help with a DAX calculation to get the stock levels for future and past months, based on current stock level and Sales/Purchase figures.
Sales and purchases figures for future months are predictions, for past months these are the real figures.
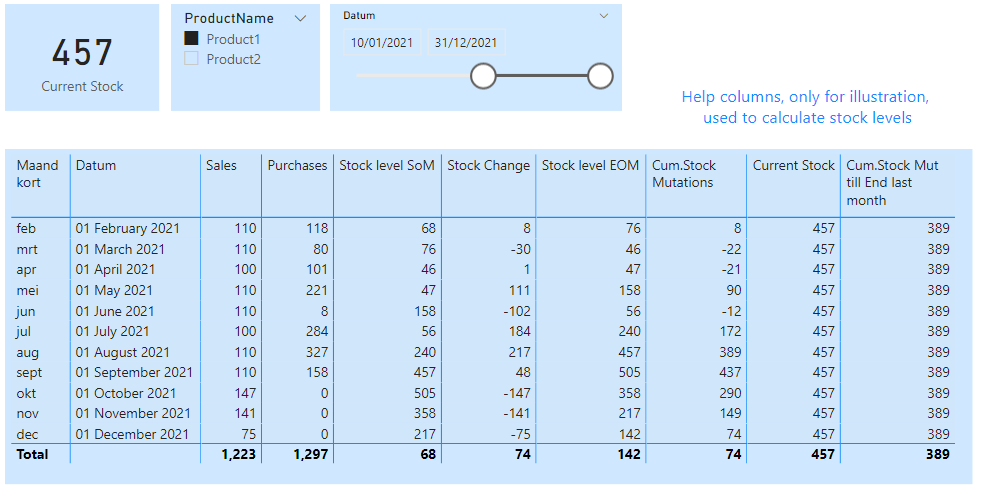
In the attached Excel file I have an example of how it should look like. Based on the Sales and Purchase figures, I have calculated the Stock change for each month.
But I only know the current Stock Level. So for future weeks, it should give me the Current Stock level + the stock change for every upcoming month YTD. And for the past months, it should count back from the current stock level with the stock changes in future months.
I have tried several things with YTD and DATESBETWEEN, but wihout succes unfortunatelly, so I hope somebody here can help me out.
Attached a dummy PBIX file and an Excel mockup with the calculations how I want them to be.
Please receive hereby a possible solution for your request.
Calculating stock levels per period, given only the current stock level available, could be done by correcting the current stock level with the cumulative stock movements. Bringing this corrected stock level back to the beginning and adding cumulative stock movements, gives the stock levels per period. PBIX attached: DummyFile Stock v18.pbix (73.8 KB)
Worked out as follows:
Determine Current stock level (always the same value, as not connected to the “Kalender”-table in the data model).
Current Stock = SUM(Stock[Stock])
Calculate the cumulative stock mutations till the current period. In this example a monthly period is used, this could also done on a daily base with Today()
Cum.Stock Mut till End last month =
Var EOM1 = EOMONTH( TODAY(),-1) //End of Month Previous Month   An alternative could be TODAY() - 1, being yesterday
Var CumStockMvmt =  CALCULATE( SUM(Purchases[Quantity]) - SUM( Sales[Quantity]),
                      FILTER( ALLSELECTED( Kalender[Datum]),  Kalender[Datum] <= EOM1 ))
return
IF( ISBLANK([Stock Change]), BLANK(), CumStockMvmt)
Note 1: with a predefined date (like EOMONTH( TODAY(),-1) ) and using ALLSELECTED( Kalender[Datum]), a NOT changing value, regardless the chosen periods, is calculated, as in this case the cumulative stock mutations till the current period, which is a necessary part to calculate stock levels for different periods
`
Note 2: using the standard formula with MAX gives the cumulative stock movements per period, in contrary of using a predefined date as mentioned in note 1.
Calculate stock levels per period (End of Month and Begin of Month)
Stock level EOM = [Current Stock] - [Cum.Stock Mut till End last month] + [Cum.Stock Mutations]
Stock level SoM = [Current Stock] - [Cum.Stock Mut till End last month] + [Cum.Stock Mutations] - [Stock Change]
Note 3: some measure-branching is used, it is also possible to integrate the steps into one measure, see also measures “Stock EOM integrated”` and “Stock SoM integrated”
A possible report is attached, which aligns with your Excel numbers. (Note the time slicer)
(The help columns are not needed in the report, only added for illustration purposes)
Thank you for that very detailed answer @deltaselect
Hi @marieke, we’ve noticed that no response has been received from you since September 12.
We just want to check if you still need further help with this post? In case there won’t be any activity on it in the next few days, we’ll be tagging this post as Solved.
Hi @deltaselect , many thanks for your detailed calculations, this really helped me out! The columns for Stock level SoM and EoM are exactly what I was looking for.