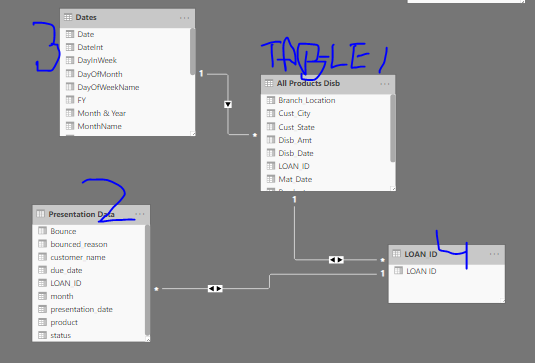
I’ve 3 tables, 1st table gives me all the disbursed cases count and the amount, 2nd table gives me all the case staus that are presented and either get bounced or cleared, 3rd tables is date table.
1st table has all the unique ids. The 2nd table has duplicate ids, as month on month data is available for each id that gets represented till the loan tenure ends.
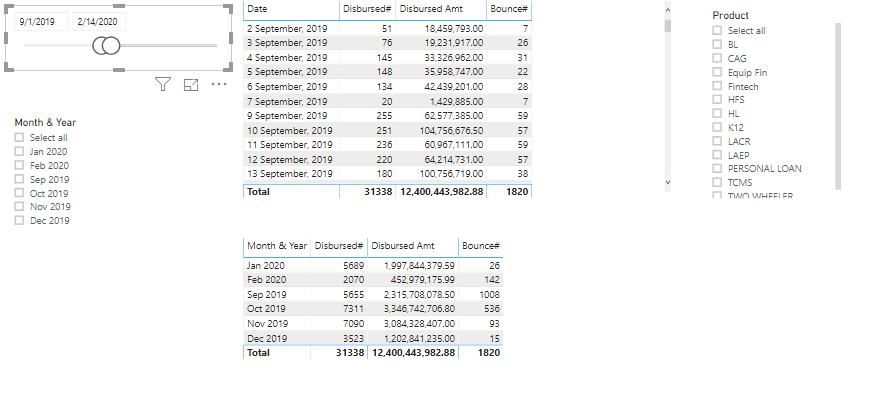
I want to calculate the count of cases disbursed in particular month;
Disbursal Count# = Count(loan_id)
Bounce# = Calculate (distinctcount(loan_id) , Filter (2nd table (status) =“Bounce” ))
I’m getting the correct result by date, product, program_type any filter I use for 1st measure, but I want to divide (Bounce# / Disbursal Count#). And want this to work if the user applies any filter on month, product or location.
2nd table has a date column but for all the id’s the date would be either 2nd or 7th of that month.
Please be patient, this isn’t an on-demand forum. Response times will likely be anywhere between 12-48 hours.
And provide as much context to a question as possible. This includes the data, the model, the formula, the filter context etc. To get good answers just post as much detail about the issue or question as possible.
Although you have provided a sample data set and described some details, not all required information is present. Can you supply a PBIX file with the data, model, measures, filters in place and if possible describe the expected/desired result - that would greatly benefit any member trying to assist you.
I could have attached pbix but it’s too large. The data I’ve attached would make sense around my model, but still, if there are any questions I’m happy to answer them.
In the meantime, I’ve also created the 4th table in this, I’ve all the unique LOAN _ID from both the tables and I’ve created a relationship amongst them.
Measures I need are only these 2. I’ll be dividing them to get my percentage.
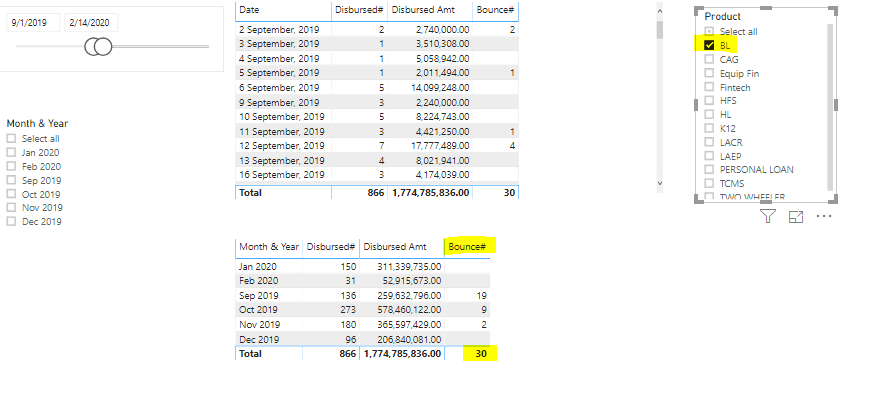
If I select Product filter (BL) in the image below, the result should be around 738 cases for Bounce#. The number in Disbursed# is correct. I’ll be adding location filter as well for the products.
@kkrj.ankit I’m having trouble replicating your findings especially because the numbers I’m getting are nothing like the ones illustrated above. So I’ve attached a PBIX where I’ve tried to replicate your starting position (without the bridge table at this time). Added a Product filter based on the Product in Table2 is that correct? And what is the Location filter you’ve referred to?
Let’s get the basics right and put our minds together so we can work towards a solution.
Thanks, Melisa for your effort. I cannot attach PBIX file as the data source is AWS and it would not work at your end.
I’ve tried to share full data for your reference, but have removed data from a few columns to reduce the file size. And to answer your question about Location, I’ll be using Branch_Location from Table 1.
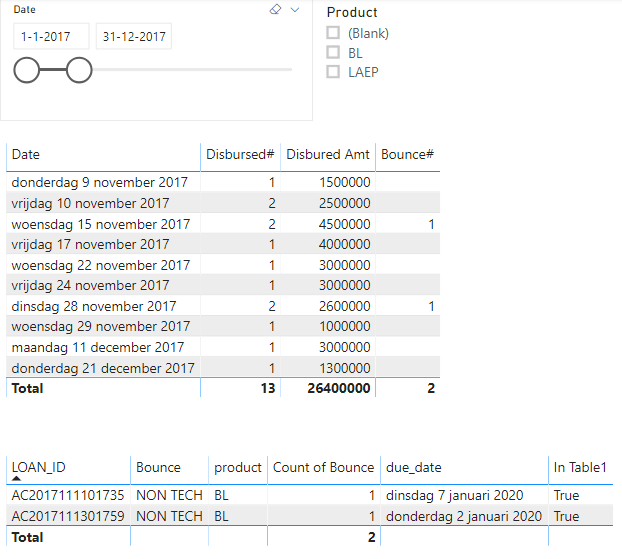
Now it looks to me that when there are no filters applied all Bounce = “NON TECH” are counted even if there are no accompanying records in Table 1 (All products Disb). I don’t know if that’s causing issues on your side or if this is due to the sample data. To overcome this, the second measure. Can you validate this and let me know…