Staff Turnover Calculation

Good Day All,
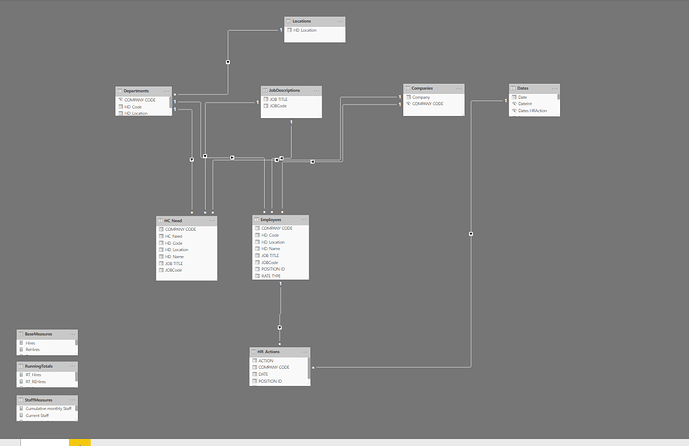
I am working through an HR report of current staff and turnover. I’m not able to use the calculations from the Videos of current staff calculation, and the further formulas for turnover, as my data model is very different than what is represented.

I’m having difficulty working out the turnover calculation as required by my HR management.
They desire turnover to be calculated as:
Monthly terminations / Average EOM Staff

My PBIX file is here: HRKPI.pbix (945.1 KB)

My data Model:

Hires Calculation
Hires =
CALCULATE([Total Actions],
FILTER(VALUES(HR_Actions[ACTION]),HR_Actions[ACTION] = “HIRE”)
)

ReHires Calculation
ReHires =
CALCULATE([Total Actions],
FILTER(VALUES(HR_Actions[ACTION]),HR_Actions[ACTION] = “REHIRE”)
)

Terminations calculation
Terms =
CALCULATE([Total Actions],
FILTER(VALUES(HR_Actions[ACTION]),HR_Actions[ACTION] = “TERMINATION”)
)

I then compute Running Totals of these three measures using this pattern:

RT_Hires =
CALCULATE([Hires],
FILTER(ALL(Dates[Date]), Dates[Date] <= MAX(Dates[Date])
)
)

And finally calculate current staff as such:
Current Staff = ([RT_Hires] + [RT_REHires]) - [RT_Terms]

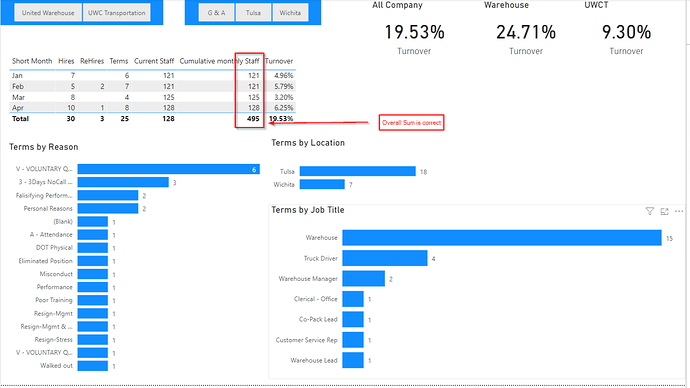
These formulas are working correctly. What I cannot seem to calculate is the monthly moving average, i.e. I need to add the EOM staff count for each month, then divide by the distinct count of preceding Months.

I’m simply trying to aggregate the monthly totals for now, and have not been able do so at the month level. I’ve been able to obtain an accurate result for the sum of overall EOM staff by using this formula:

Cumulative monthly Staff =
Var MinDate = Calculate(MIN(Dates[Date]),ALLSELECTED(Dates))
Var MaxDate = CALCULATE(MAX(Dates[Date]),ALLSELECTED(Dates))
Var DateRange = FILTER(ALL(Dates), Dates[Date] >= MinDate && Dates[Date] <= MaxDate)

Return
Sumx(Filter(
SUMMARIZE(DateRange, Dates[Short Month],
“Staff”,[Current Staff],
“MonthNumber”, MIN(Dates[Short Month])),Dates[Short Month] <= MAX(Dates[Short Month])),
[Current Staff])

I need a nudge in the right direction to complete this calculation. What I am after is here:

Any assistance will be much appreciated.
Regards,
Jamie
1 Like

One of the reasons your measure wasn’t working was because you were trying to iterating over the Dates[Short Month], changed that to Dates[MonthnYear] which is a full numeric key for both Month & Year, so at the same monthly granularity. That should do the trick…

Cum monthly Staff = 
VAR MinDate = CALCULATE( MIN(Dates[Date]), ALLSELECTED(Dates))
VAR MaxDate = CALCULATE( MAX(Dates[Date]), ALLSELECTED(Dates))
VAR vTable = SUMMARIZE( FILTER( ALL(Dates), Dates[Date] >= MinDate && Dates[Date] <= MaxDate), Dates[MonthnYear], "Staff", [Current Staff] )
RETURN

SUMX( 
    FILTER( vTable,
        Dates[MonthnYear] <= MAX( Dates[MonthnYear] )),
    [Staff] )

.
I hope this is helpful.

2 Likes

Thank you very much!!
This indeed “did the trick”! :clap:

Hi @Melissa I see you use [Staff] and that confused me as I can’t find that measure anywhere.
Also are you able to explain how MAX works with respect to the visuals when displayed on table as I am getting confused slightly. If I get this formula you are saying the sumx will iterate over the vtable and go to the monthnyear column to check whether it is less than or equal to the max of the monthnyear. Here is where I get confuse. On the visuals displayed on the tables for Jan what is the max? Is the date table for jan filter all records for 1 to the 31 of Jan? And in Feb what is the max? Does the table now filter from 1st Jan to 29 of Feb ? That will be appreciated if you could explain. Thanks.

Hi @ambepat

I’ll certainly do my best to explain what’s going on :wink:

I totally get this is confusing. [Staff] is a column from the virtual table, because its a virtual table we’re not allowed to reference it as vTable[Staff] but only by the ‘naked’ column name…

The goal here was to generate a monthly result, as you can see by the placement of Dates[Short Month] on the rows of the table (marked in green). What you can’t see is that there‘s also context coming from the Dates[Year] via the report Filter Pane.
image

So to create an iteration over the Date dimension table that matches this exact granularity, we’ll end up with just two contenders the Dates[Month & Year] and Dates[MonthnYear] column. Now the first is alphanumeric, the second numeric making it the winner in this contest and perfectly suitable for a cumulative pattern…

Cum monthly Staff =
VAR MinDate = CALCULATE( MIN(Dates[Date]), ALLSELECTED(Dates))
VAR MaxDate = CALCULATE( MAX(Dates[Date]), ALLSELECTED(Dates))
VAR vTable = SUMMARIZE( FILTER( ALL(Dates), Dates[Date] >= MinDate && Dates[Date] <= MaxDate), Dates[MonthnYear], "Staff", [Current Staff] )
RETURN

SUMX(
FILTER( vTable,
Dates[MonthnYear] <= MAX( Dates[MonthnYear] )),
[Staff] )

.

.
Try reading the row section of the table visual like this. There is context coming from the Short Month but as I mentioned above there is also context on Date[Year] thus you can read ‘Jan’ as ‘Jan 2020’ and in the Date table that corresponds to the Dates[MonthnYear] value 20200100 so for the first row 20200100 is the MAX. On the second row the MAX is 20200200 so when we iterate over the vTable is sums the first and second row - and so on.

There is no daily- only a monthly granularity because we’re not iterating over each day of the month but rather each month in the year…

Short Month is in fact and equal to
Jan Jan 2020 20200100
Feb Feb 2020 20200200
Mar Mar 2020 20200300
Apr Apr 2020 20200400

.
I hope this is helpful.

3 Likes

Hi @Melissa thanks for the explanation.

What will you do to achieve the same result just by using Calculate and not Sumx? What would you do differently.

Also I have been learning DAX now for almost a year and I am now transitioning to understanding the engine and asking why? It is a bit challenging given i sometimes try to read articles from Alberto and Marco in SQLBI. Those articles sometimes are really tough to understand but I am just keeping at it to push myself to continue to learn and grow.

Can I just ask how many years have you been working with DAX as you seem like you really know the fine details into the language and what are some tips you could advise on how to improve daily?

Thanks again for your explanations. Really helpful.

I hope you don’t mind me jumping into this conversation, but I have two tips that really help me advance my DAX skills:

  1. a few times a week, familiarize yourself with a DAX function you didn’t previously know. The Enterprise DNA Knowledge Base, the SQLBI DAX guide and the Definitive Guide to DAX are all great sources for this exercise. You don’t need to master each function, but just make sure you know what it does, generally how it works, and when it’s appropriate to apply it. That way when you come across a problem that needs a new technique you’ll be able to draw back on that knowledge and think “oh, I’ve seen something before that handles this exact problem”. This will help you a lot in 2) below…

  2. every day, try to answer a question on the forum that stretches you. In addition to helping others, you’ll find that over time this is one of the best if not the best way to improve your skill set. If you’re like me, in your day job, you learn the functions and constructs in Power BI necessary to do your work well. However, over time you master what’s necessary for your particular work and don’t always continue to be stretched and grow in your application of DAX (and PQ). However, on the forum you’ll run into all sorts of unusual and unfamiliar problems that will require you to learn new functions, new ways of applying functions that you already know, and also expose you to others’ approaches that I guarantee you’ll appreciate much more and learn much more from after you try solving the problem yourself as opposed to just reading their solutions. If you are working on one, and someone posts a solution in the interim, still go ahead and post your solution – it’s always valuable for people to see multiple ways of doing things and different thought processes. As you have time and energy, occasionally take a shot at a super difficult question that really forces you to deep dive into a new area.

I think of this like going to the gym. If you do it steadily for a month, you’ll be amazed at how much progress you make over that time, and how things that initially seemed difficult become second nature.

Good luck! I hope this is helpful to you, and I’ll keep an eye out for your future solution posts… :wink:

  • Brian
2 Likes

Thanks Brian J. You actually said what I was thinking of doing at point 2. Will definitely follow through on it and aim to do it daily and see how it goes

Appreciate the advise.

1 Like

@BrianJ couldn’t agree with you more!

@ambepat the forum is the place to gradually expand your skills and if you invest in not only providing the ‘quick’ answer but also try to provide relevant context and insights - you’ll notice that you’ll get a better understanding as a whole.
Hope to see you around the forum and best of luck! :smiley:

1 Like

@Melissa,

I use the exact same naming conventions that you do - preface all my virtual tables with a lowercase “v”, but still use standard names for the columns in the virtual table, leading to the exact type of ambiguity that generated @ambepat’s question about whether [Staff] was a measure or not. Previously, I believe Marco Russo advocated using a convention that would name the staff column “Staff[vTable]”, which clarifies its table lineage and avoids the column versus measure confusion. However, I was never completely comfortable with this, since it gave the impression that this was a standard table/column call, which it is not.

However, relatively recently Russo and Ferrari have started using a different convention, which names the staff column “@Staff”. I like this a lot. It doesn’t address the table lineage question, but does stand out, is easy to remember and and helps avoid the column versus measure confusion if adopted consistently.

I wanted to see what you and others thought about this, and whether there might be general support for adopting this as a forum-wide standard approach/best practice?

  • Brian

@BrianJ

I’m in… Let’s give that a try. :upside_down_face:

1 Like

I couldn’t agree more @Brian … I’ve been doing your 2nd point for a few months now, and it really keeps me up-to-date with Power BI and DAX (especially since my clients tend to use “old” versions of PBI and minimal DAX…). Greg

1 Like

@Greg,

Great – keep it up! You’ve been generating some terrific solutions, and I always look forward to reading your posts.

  • Brian

I’m still on your number one, trying to work up the courage to try your number 2.

I typed an answer to ambepat’s first question here, and actually had the correct one though not nearly as thorough as Melissa’s. I was also concerned that it was poor etiquette to answer a question that was directed at a specific individual.

I’m working through the DAX functions, and the courses here while trying to produce work for my organization, and improve the work that I’ve already done. Bouncing back and forth from “basics” to some advanced things through the plethora of resources here.

Since I got my membership I think I’ve visited the site and learned something virtually every day. I’ll get to the point where I can help others as quickly as I can.

Jamie

Don’t let anything hold you back from participating if you want to and can…

This is a place where the community appreciates members who contribute and share their knowledge, let’s be honest it’s also the best way to learn… :wink:
So when a question comes along you feel comfortable responding to, just go for it.

See the forum guidelines for tips on answering questions.

I look forward to reading your posts :+1:

1 Like