Have you had a chance to work through this workshop here as this covers many of these calculations for HR data.
As with anything here the data matters a lot.
So with your data you have to manage multiple dates…very doable.
This is where the ‘events is progress’ pattern comes into play. See below for the exact technique to use from a modelling and DAX formula perspective.
This is a different scenario exampled above but the technique is exactly the same.
I’ve worked on something briefly here to show you.
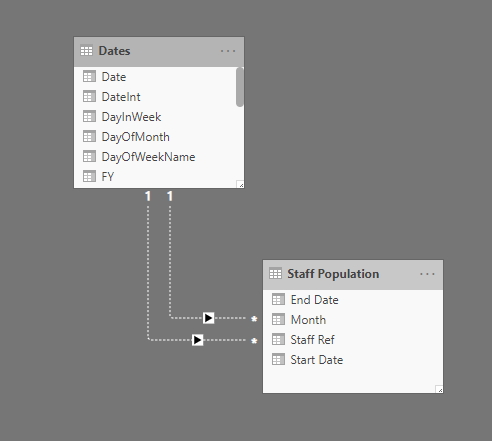
Model here, notice the inactive relationships…

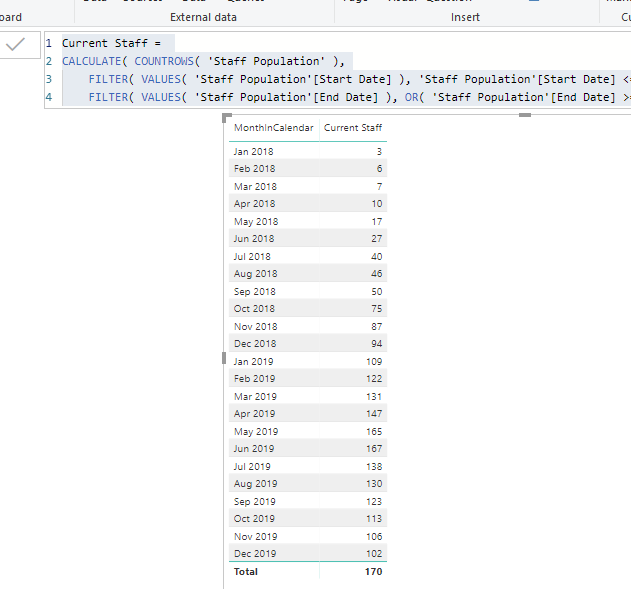
I had to have a play around with a few ideas but this is what I came up with.
Current Staff =
CALCULATE( COUNTROWS( 'Staff Population' ),
    FILTER( VALUES( 'Staff Population'[Start Date] ), 'Staff Population'[Start Date] <= MAX( Dates[Date] ) ),
    FILTER( VALUES( 'Staff Population'[End Date] ), OR( 'Staff Population'[End Date] >= MIN( Dates[Date] ), ISBLANK( 'Staff Population'[End Date] ) ) ) )
You’ll see I had to adjust a few things but the idea and technique is the same.
I did a quick audit and it looks close…I think.
You’ll have to work through and make sure, but hopefully you get the idea and can work on it from here.
Attached
Staff Popn.pbix (138.2 KB)
Sam
