Stacked column chart colors for many products

I’ve made a mock data PBI file to illustrate my issue:

Mock Data PBI.pbix (1.2 MB)

I have a stacked column chart with many products:

it isn’t useful until a brand is selected. In this chart I have selected a brand and then manually changed the colors:

So it looks nice but if i don’t manually change the colors some brands look like this:

But with hundreds of products I don’t want to manually change the colors for each single product.

Is there a way of getting the stacked column chart to stick with the color theme that I currently have?

I found the guy in a cube video of creating a custom legend with color formulas but i’m not sure this is what I’m looking for

Thanks,

Tim

Hi @Timmay

An option is use Drill-down technique please read the following article.

hi jbressan,

I had a look at the drill down article. Can you please explain how this can be used to solve my issue?

Thanks,
Tim

I’m just wondering if you could group the sku and then use grouping heading in your graph

1 Like

Thanks for the suggestion Keith. Brands are sku groupings. For example:

Brand 1 contains the SKU
11
12
13
14

Brand 2 contains the SKU

21
22
23

etc

ok…just a thought

1 Like

I found something on Youtube that might help

I’m not sure if you noticed this one?
thanks

1 Like

Ah, I haven’t seen that one.

Great thanks I’ll check it out.

This is a great video thanks Keith but unfortunately doesn’t solve my issue, I would still need to set all the colours individually for each product

i don’t see anything else that i can see. You may not have any other choices without setting up at the beginning but you will then have it completed. Sometimes in projects you have to do the manual work to get the results latter in the project. :slight_smile:

Another option is post the question directly on the Microsoft power bi community

Hi @Timmay

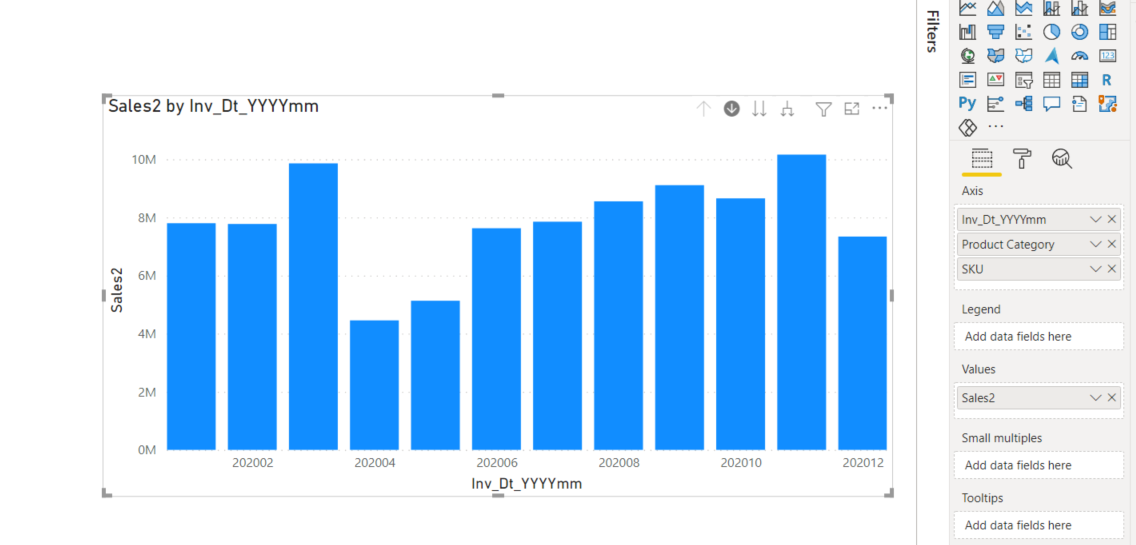
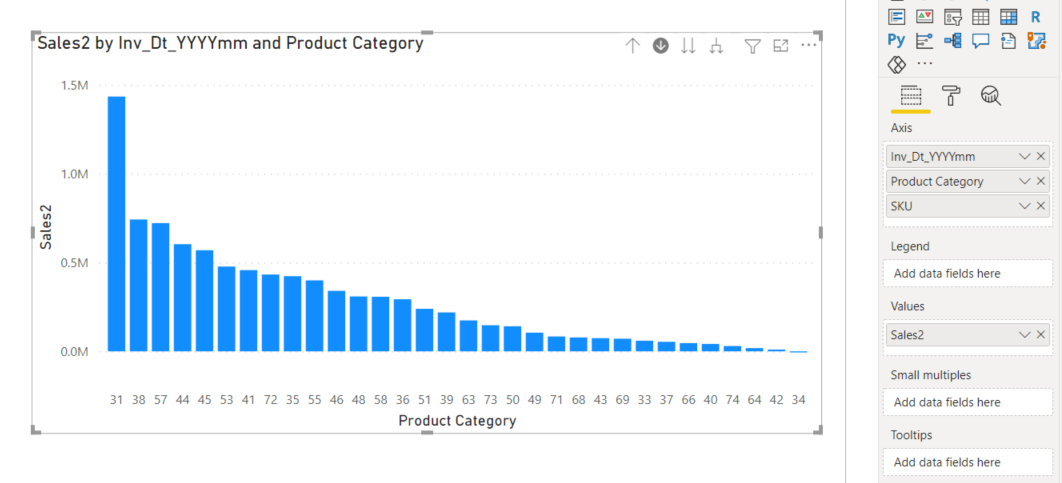
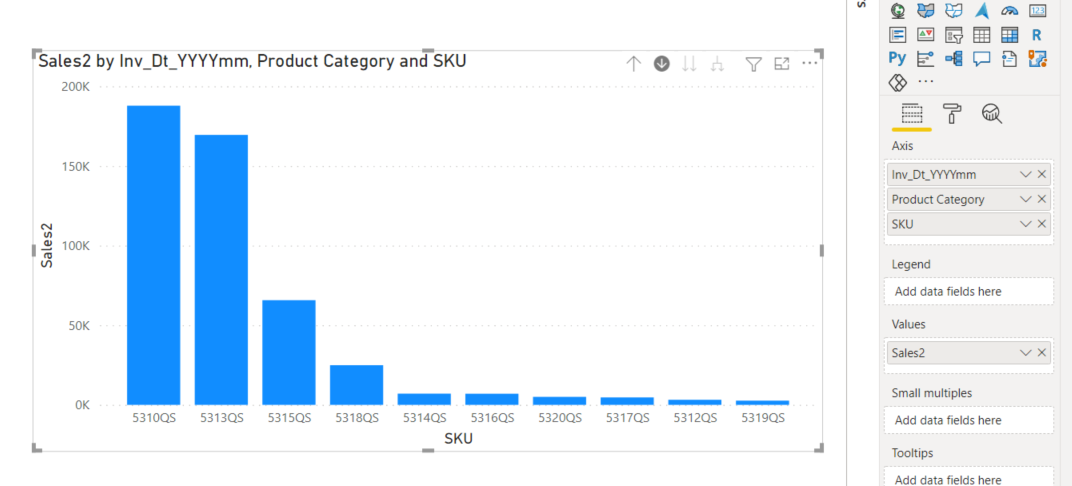
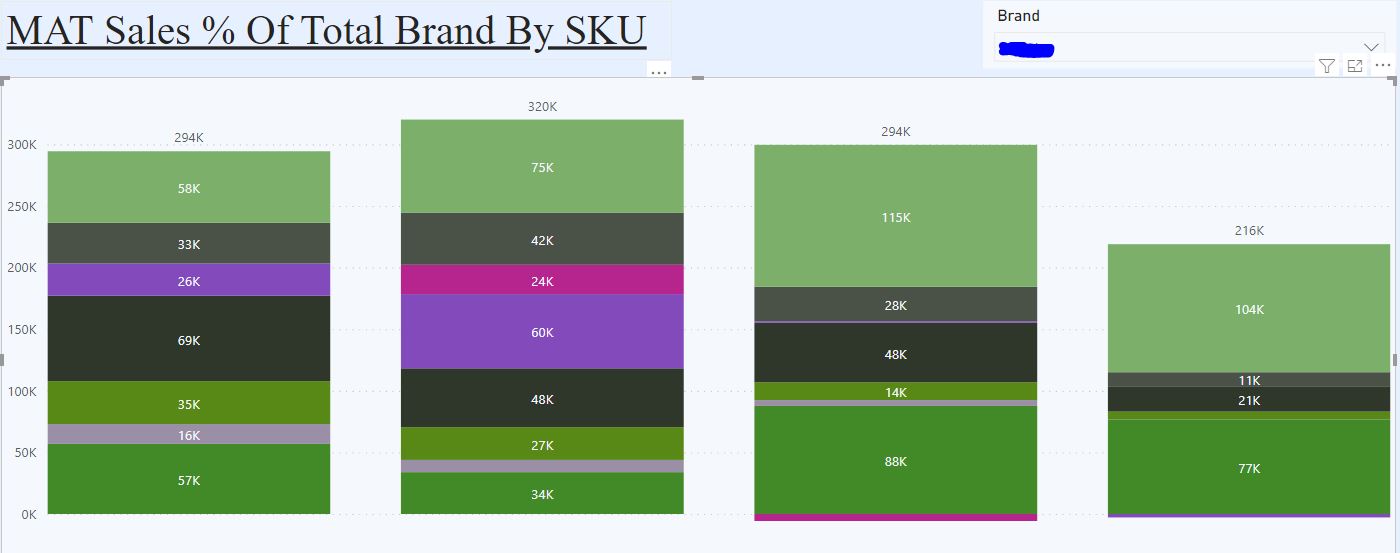
This is a sample of Informal Hierarchy to handled the Drill-Down navigation of the bar chart.
This hierarchy is compose at first level with the time period, at second level the product category and SKU for the last level

Mock Data PBI.pbix (1.2 MB)

Hi @Timmay, did the response provided by @Keith and @jbressan help you solve your query? If not, how far did you get and what kind of help you need further? If yes, kindly mark as solution the answer that solved your query. Thanks!

Hi @Timmay, we’ve noticed that no response has been received from you since the 15th of March. We just want to check if you still need further help with this post? In case there won’t be any activity on it in the next few days, we’ll be tagging this post as Solved.

Hi @Timmay, a response on this post has been tagged as “Solution”. If you have a follow question or concern related to this topic, please remove the Solution tag first by clicking the three dots beside Reply and then untick the check box.

We’ve recently launched the Enterprise DNA Forum User Experience Survey, please feel free to answer it and give your insights on how we can further improve the Support forum. Thanks!