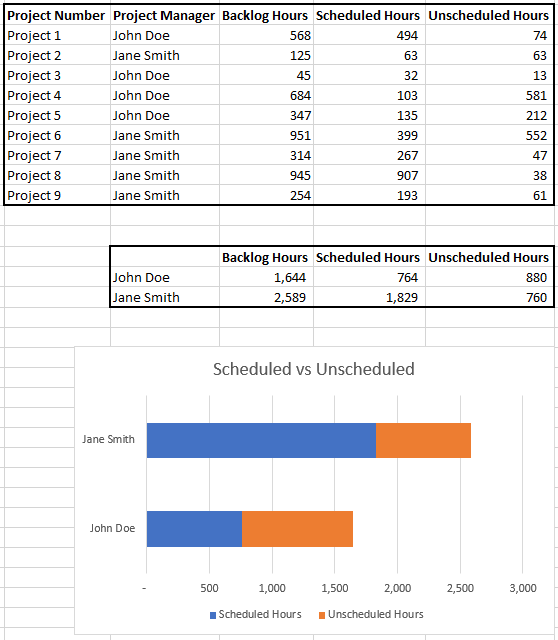
I was wondering if it was possible to have a stacked bar chart from two DAX Measures or adding two additional columns in my tables. This is very simple in excel by doing SUMIFs off the main table and then doing a chart off of those values.
I’m wanting to stack scheduled hours and unscheduled hours so it visually shows how much of professional service hours are scheduled
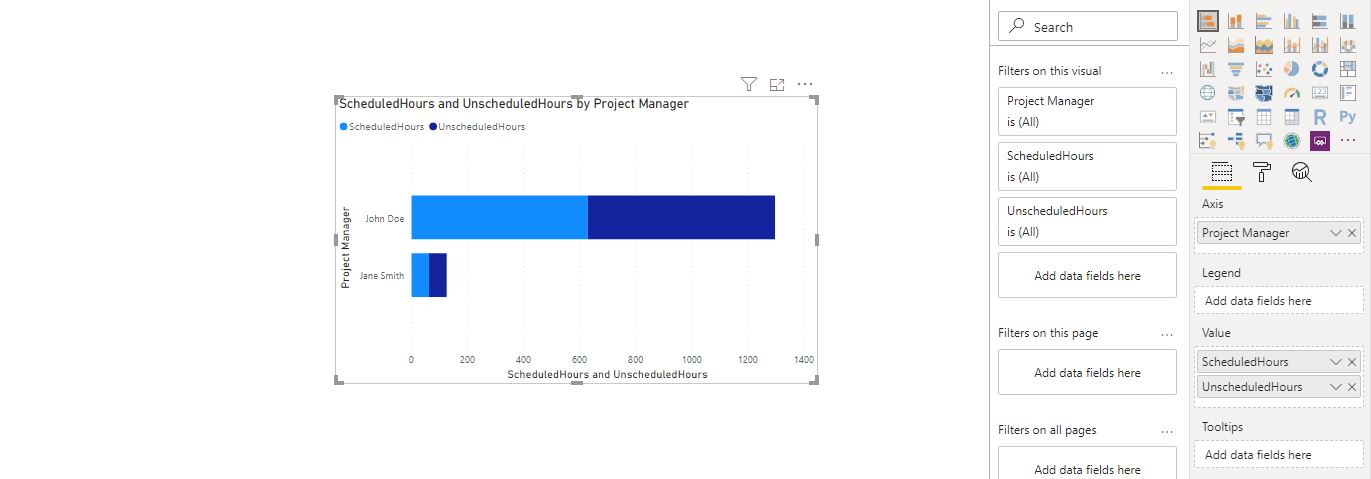
There are two measures
Unscheduled Hours = Sumx(Hours,Hours[Unscheduled Hours])
ScheduledHours = Sumx(Hours,Hours[Scheduled Hours])
Then you can drag the Project Manager in the Axis Field and these 2 measures in the Values field. ( I have only entered some data from your snapshot so it is not showing everything).