Sparkline Graph is compressed

Hi,
I am new to Power Bi and DAX.
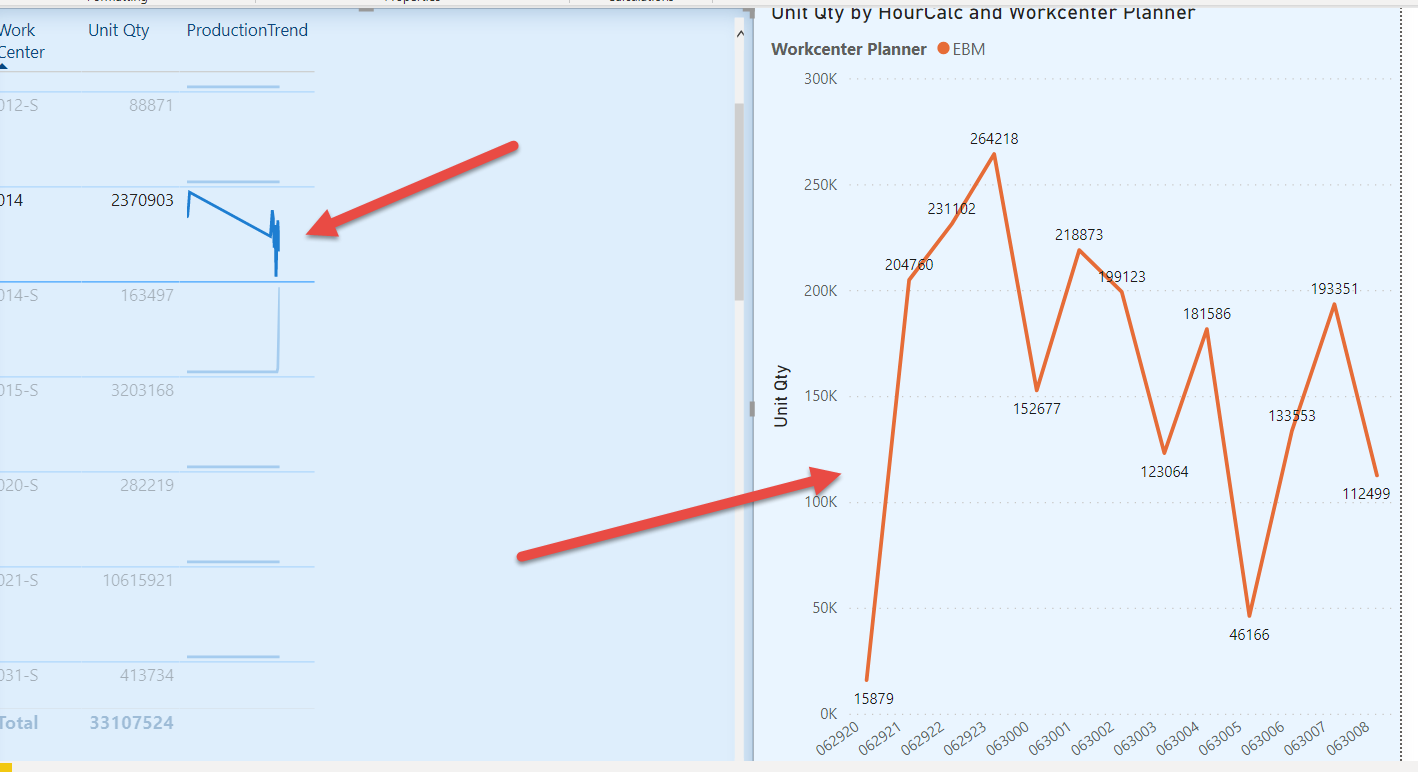
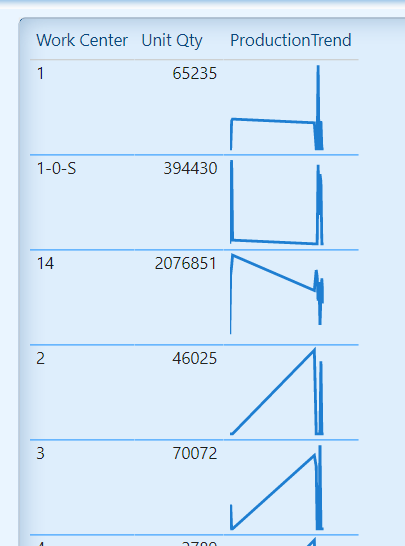
I need to show a trend line for the last 12 hours production for each record in a table . I have used DAX measure to draw a sparkline graph and changed the category of the measure to Image URL to display it as an image in the table . But for some reason the graph is compressed and I am not able to view the data points properly.
It is accumulating all the data on the right hand side of the graph if the last 12 hours include double digit. For example, if it is 10th hour of the day currently, the last 12 hours will include23rd hour from yesterday (last night) and 0-10 for today’s date.(i.e. from yesterday 10pm to 10AM today= last 12 hours).

Below is the screenshot of the issue:

DAX code for the sparkline graph:

ProductionTrend =

VAR LineColor = “#1E7ED1

VAR XMinDate = MIN(‘Last12Hours’[HourCalc])
VAR XMaxDate = MAX(‘Last12Hours’[HourCalc])
VAR YMinValue = MINX(VALUES(‘Last12Hours’[HourCalc]),CALCULATE(SUM(Transactions[Unit Qty]))+0)
VAR YMaxValue = MAXX(VALUES(‘Last12Hours’[HourCalc]),CALCULATE(SUM(Transactions[Unit Qty]))+0)

VAR SparklineTable = ADDCOLUMNS(
SUMMARIZE(‘Last12Hours’, ‘Last12Hours’[HourCalc]),
“X”,INT(100 * DIVIDE(‘Last12Hours’[HourCalc]- XMinDate, XMaxDate - XMinDate)),
“Y”,INT(100 * DIVIDE(CALCULATE(SUM(Transactions[Unit Qty])+0) - YMinValue,YMaxValue - YMinValue)0.90 + (1000.05)))

VAR Lines = CONCATENATEX(SparklineTable,[X] & “,” & 100-[Y]," ", [HourCalc])

VAR SVGImageURL = IF(HASONEVALUE(‘WorkOrder’[Work Center]),
“data:image/svg+xml;utf8,” &
“” &
“”,
BLANK())
RETURN SVGImageURL

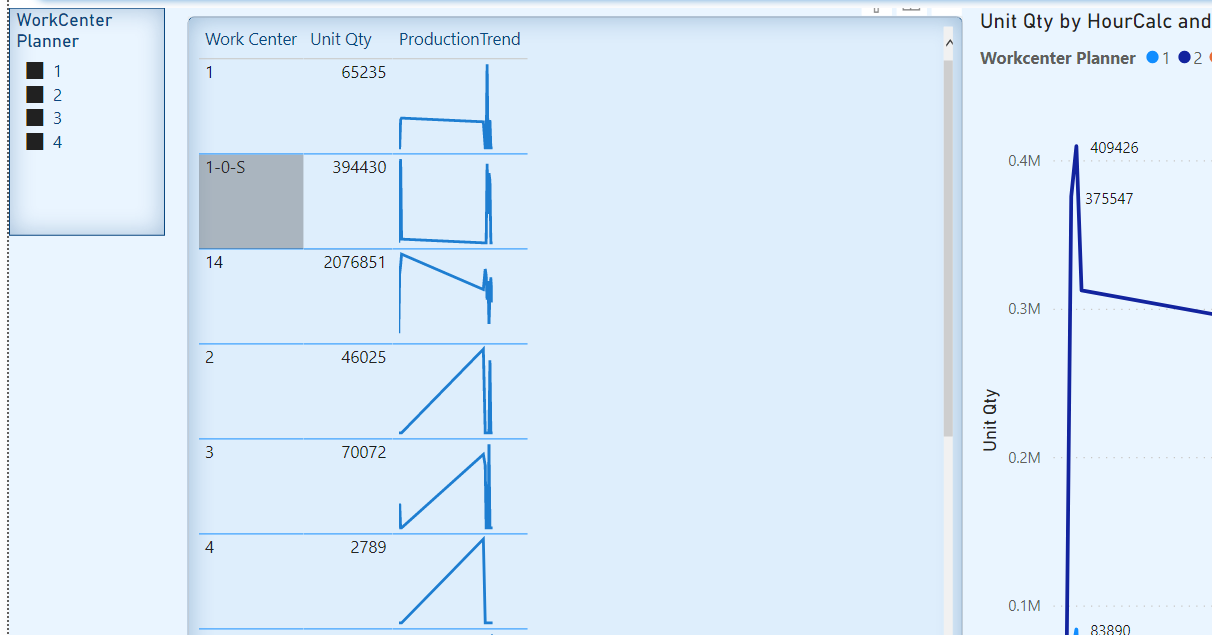
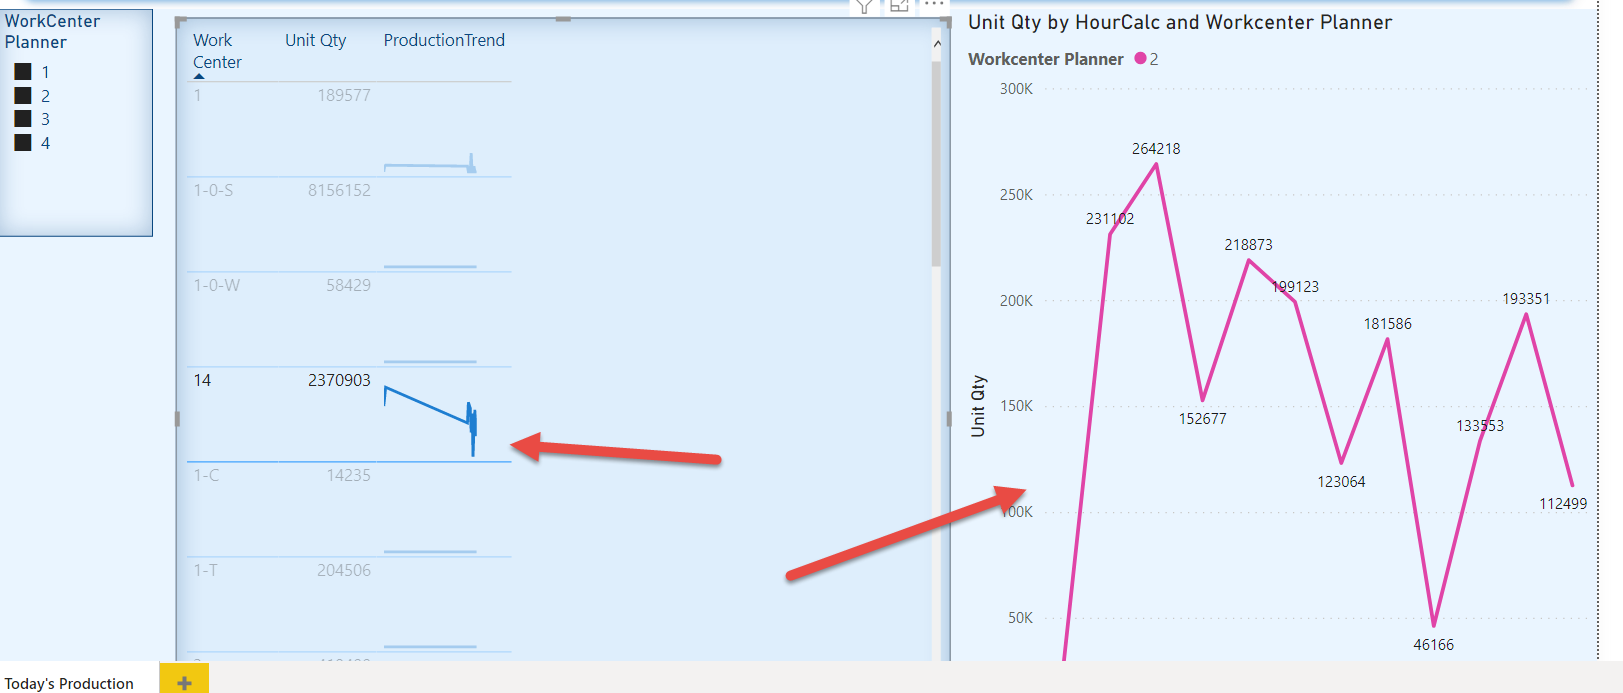
The correct graph should look like the big graph on the right hand side when selecting one sparkline as shown below:

Please find attached the pbix file to review the issue.
Production EfficiencyFINAL.pbix (3.0 MB)

Thank you very much in advance! :slightly_smiling_face:

Welcome to the forum @gkhokher.
Thank you for sending in your inquiry with a PBIX file and a detailed explanation.

Bumping this post for more visibility.

Hi @gkhokher, we’ve noticed that no response has been received from you since the 30th of June.

We are waiting for the masked demo pbix file, details of how you want to visualize a result, and any other supporting links and details.

In case there won’t be any activity on it in the next few days, we’ll be tagging this post as Solved.

Hi @EnterpriseDNA , The problem that I am facing is the sparkline graphs (in the screenshot I provided in the original post) are accumulating all the data points at one place. They are not scattered and making the graph compressed and hard to read/see. if last 12 hours include the double digit hours, for example, 22nd or 23rd hour of previous day, the graph will plot it on the left hand side but for the 1st hour, 2nd hour or any other hour of the current day, it will plot all the data points on the right hand side. you can see in all the sparkline graphs, there is one data point on the left then everything else accumulates on the right hand side.

How I want to visualize the result?
Each graph should look like the graph on the right hand side. For example, if you click on any one of the sparkline graphs, the graph on the right hand side would also change. So the selected graph should look exactly like the graph on the right hand side (the big graph). Please see below:

I am attaching the original pbix file with this post.

I am not sure if I answered your questions. Please let me know…
Production EfficiencyFINAL.pbix (3.0 MB)

Thank you for the support and guidance in advance!

Are you able to use another visual? OKViz KPI card or the Small Multiples Line Chart might offer more flexibility

Hi @cmalone1112 , I need to show the graph in a table in each row (As shown below). Does OKViz KPI card has that functionality?

Hi @gkhokher! We noticed that your inquiry was left unsolved for quite some time now. We strive to answer ALL inquiries in the forum.

However, if you are sure that you provided all pertinent context to your concerns and read how to use the forum more effectively and still find your question unanswered, you can check out tutorials to learn this yourself as your membership also comes with relevant resources that may help you with your Power BI education.

While our users and experts do as much as reasonable to help you with your inquiries, not all concerns can be attended to especially if there are some learnings to be done. Thank you!

Hi @gkhokher,
Sorry for the late delay - I had put this model together to show my team how it works

Viz_OKViz_Small_Multiples.pbix (855.4 KB)

2 Likes