Hi, is there any way to add a sparkline to one column that is a sparkline for multiple measures? I have the measures to show on rows (in a matrix), so want a sparkline next to the total to show the movement over the months. If there is another visual that would get the job done that would be good also. Thanks.
Hi @meldon,
There are many youtube videos on sparklines that you can review.
Here is just one that might be able to help you.
Create your own KPI SPARKLINE using DEFAULT VISUALS in Power BI // Beginners Guide to Power BI (youtube.com)
Thanks
Keith
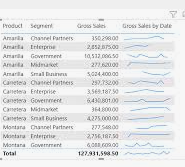
Hi Keith, the video didn’t help. I could create a line graph for each, but they don’t size small enough to be able to put them next to each row. There are lots of YouTube videos on typical sparklines. For example, the below. My measures are on rows, with months as columns. I am after a visual like a sparkline, that would show the variances going down the list.
your screen print is so small that can hardly read it.
Maybe a up arrow with a % of change from the previous month etc. i’m sure there is a youtube video that you can view or put your request through your AI tool (Data Mentor). Ask chatgpt.
Maybe small multiples work?
I’ll give small multiples a go.
Small multiples didn’t work either.
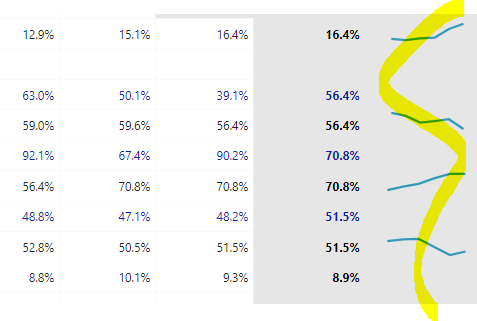
I ended up using the Power KPI Matrix 3.1.1 visual.
Hi @meldon
I’m glad you figured it out. ![]() Would love to see what the final view looked liked.
Would love to see what the final view looked liked.
Thanks
Keith