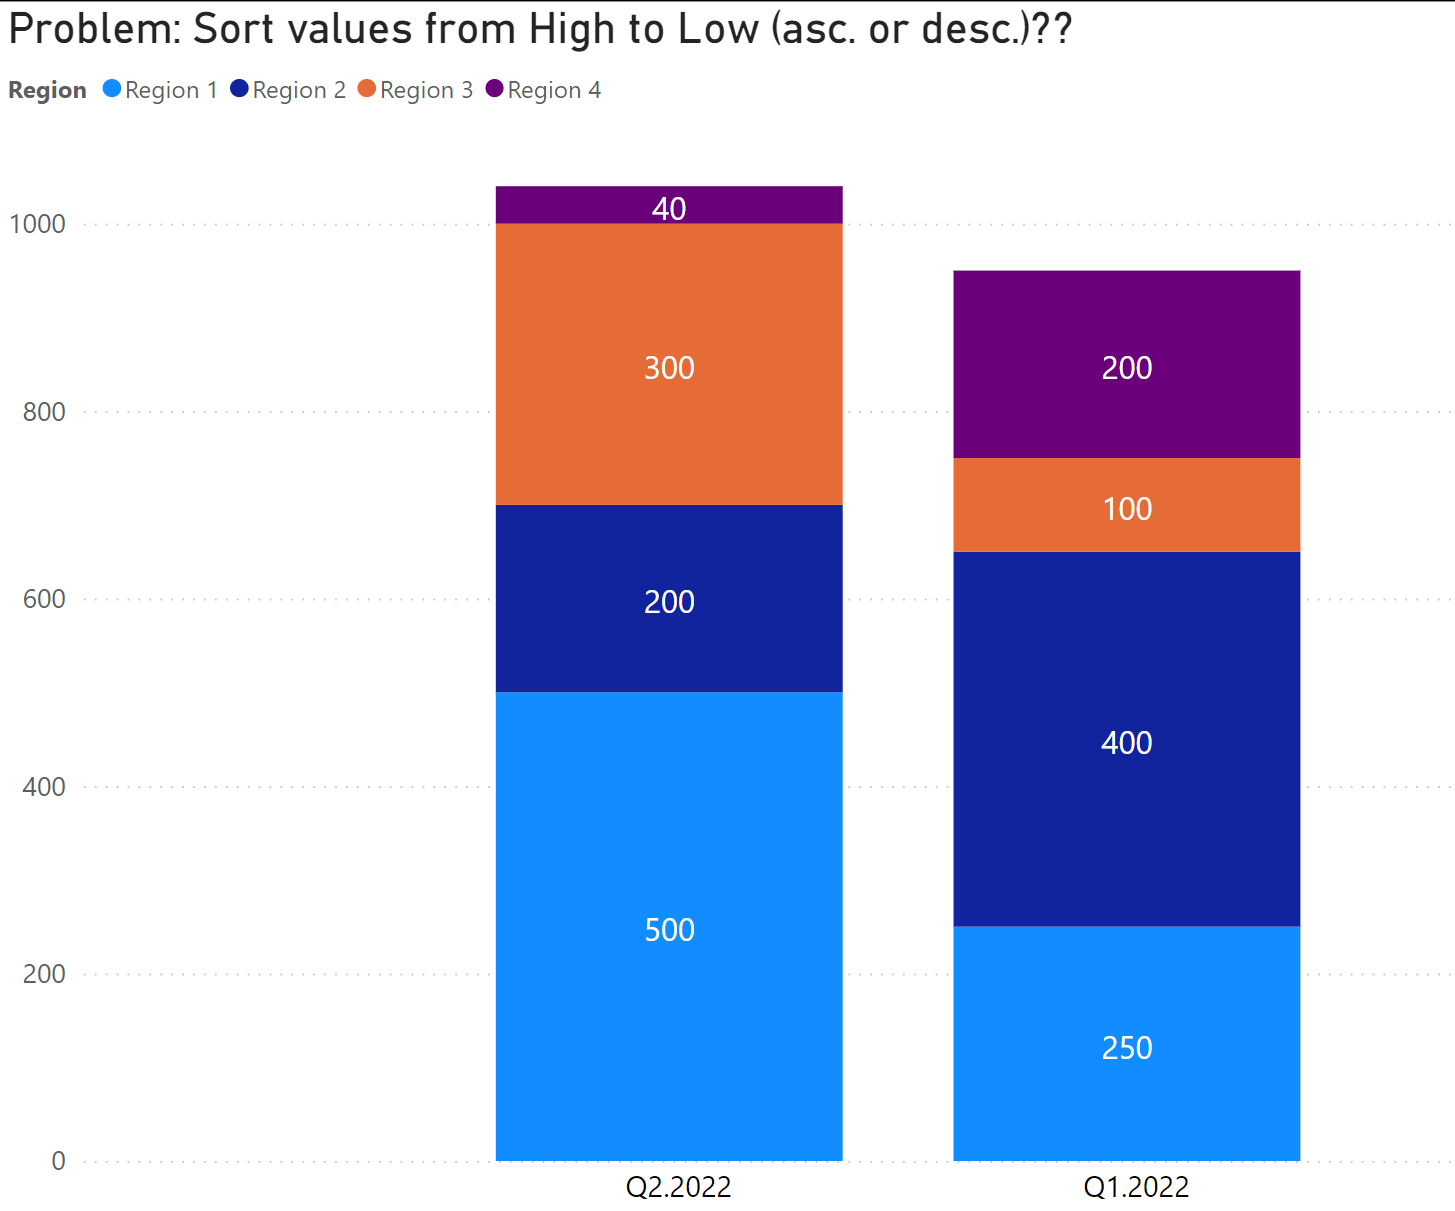
I’m fairly certain this requirement is not supported “out-of-the-box”. Please refer to simple .pbix file and data source, as attached. Goal is to sort the values in each Bar below, from high to low, such that in Q1 (for example), the values are sorted from 500, 300, 200, and 40. In Q2, they would sort as 400, 250, 200, and then 100.
Stacked Bar Chart __ Sorting values.pbix (28.8 KB)
(upload://yisDcGaGlNRV85O2BM1xu1gSUzI.pbix) (28.8 KB)
Rank dollars within a bar chart.xlsx (10.0 KB)
1 Like
Hi @mdalton2100,
The Stacked Column Chart does not allow us to order the legends according to the value of the measure in each of the categories on the X axis, but instead orders the entire category according to the total value of each category (Q1.2022 and Q2.2022).
You can see it in the following post by @Harsh in the forum and how you could use the Ribbon Chart as @datazoe tells us in the same thread.
How to sort data in Visual - Data Visualizations - Enterprise DNA Forum
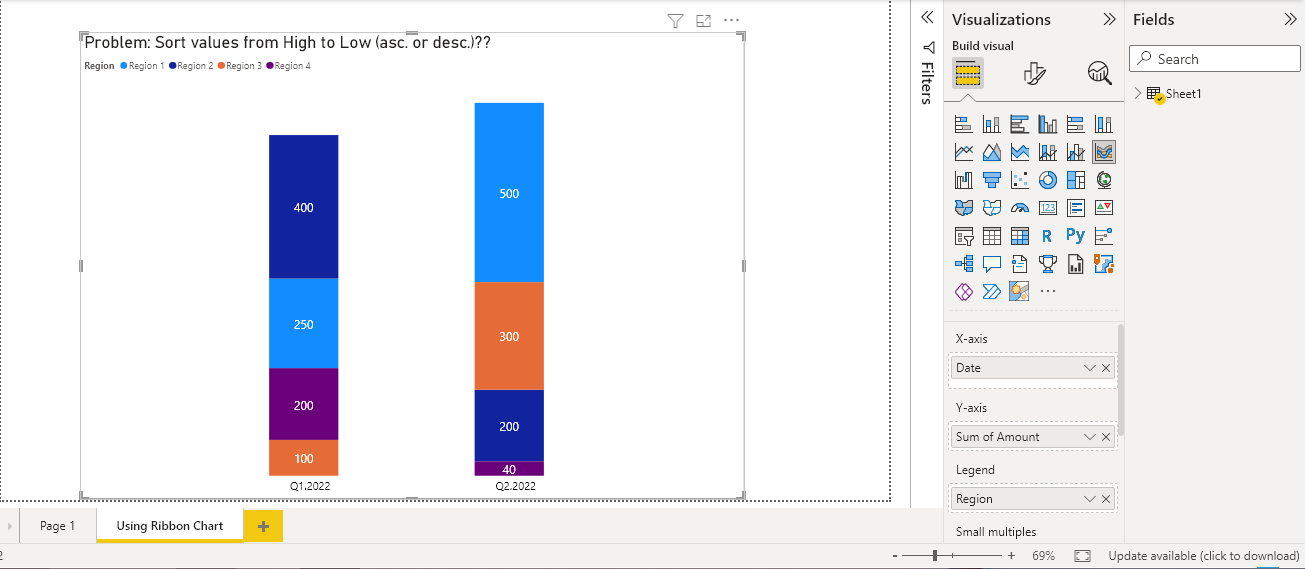
This is the example using Ribbon Chart:
Regards
Stacked Bar Chart __ Sorting values_JAFP.pbix (29.2 KB)
1 Like
Thank you so much for that detailed answer @jafernandezpuga
We hope this helped you @mdalton2100 
If not, how far did you get and what kind of help you need further?
If yes, kindly mark as solution the answer that solved your query.