Snapshot amount based on date filter

|Invoice ID| planned amount| date|

|3|. 200|. 10/06/2022|
|3|. 300|. 23/06/2022|
|3|. 400|. 31/07/2022|
|4|. 700|. 19/06/2022|
|4|. 1000|. 23/06/2022|
|4|. 600|. 30/07/2022|

Hello there,

I have a table akin to the above where an amount can change over time for an ID. For ID 3, up until and including 22/06/2022, the amount was 200. From 23/06/2022 to 30/07/2022, the amount was 300 and from 31/07/2022 and onwards it is 400.

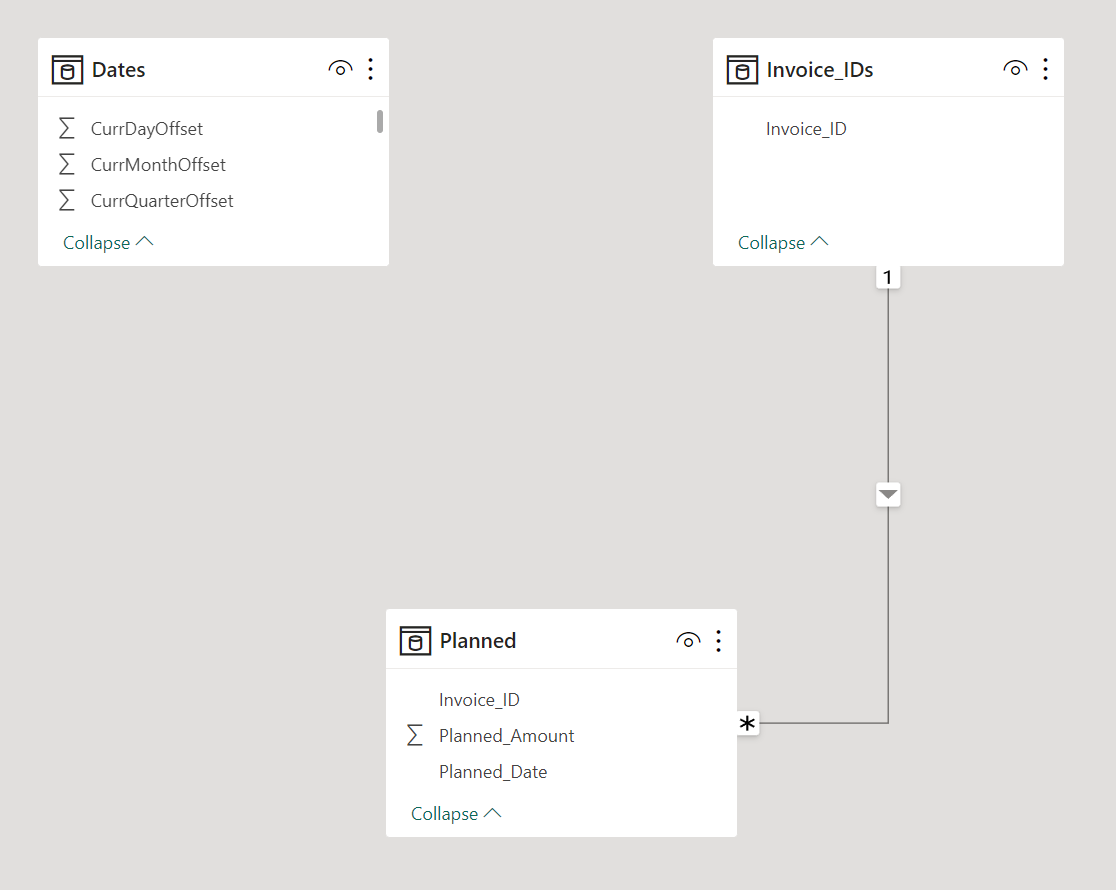
This table is joined to a calendar table on date and there will be date filter.

I want to be able to show the total amount at a point in time based on the date filter.

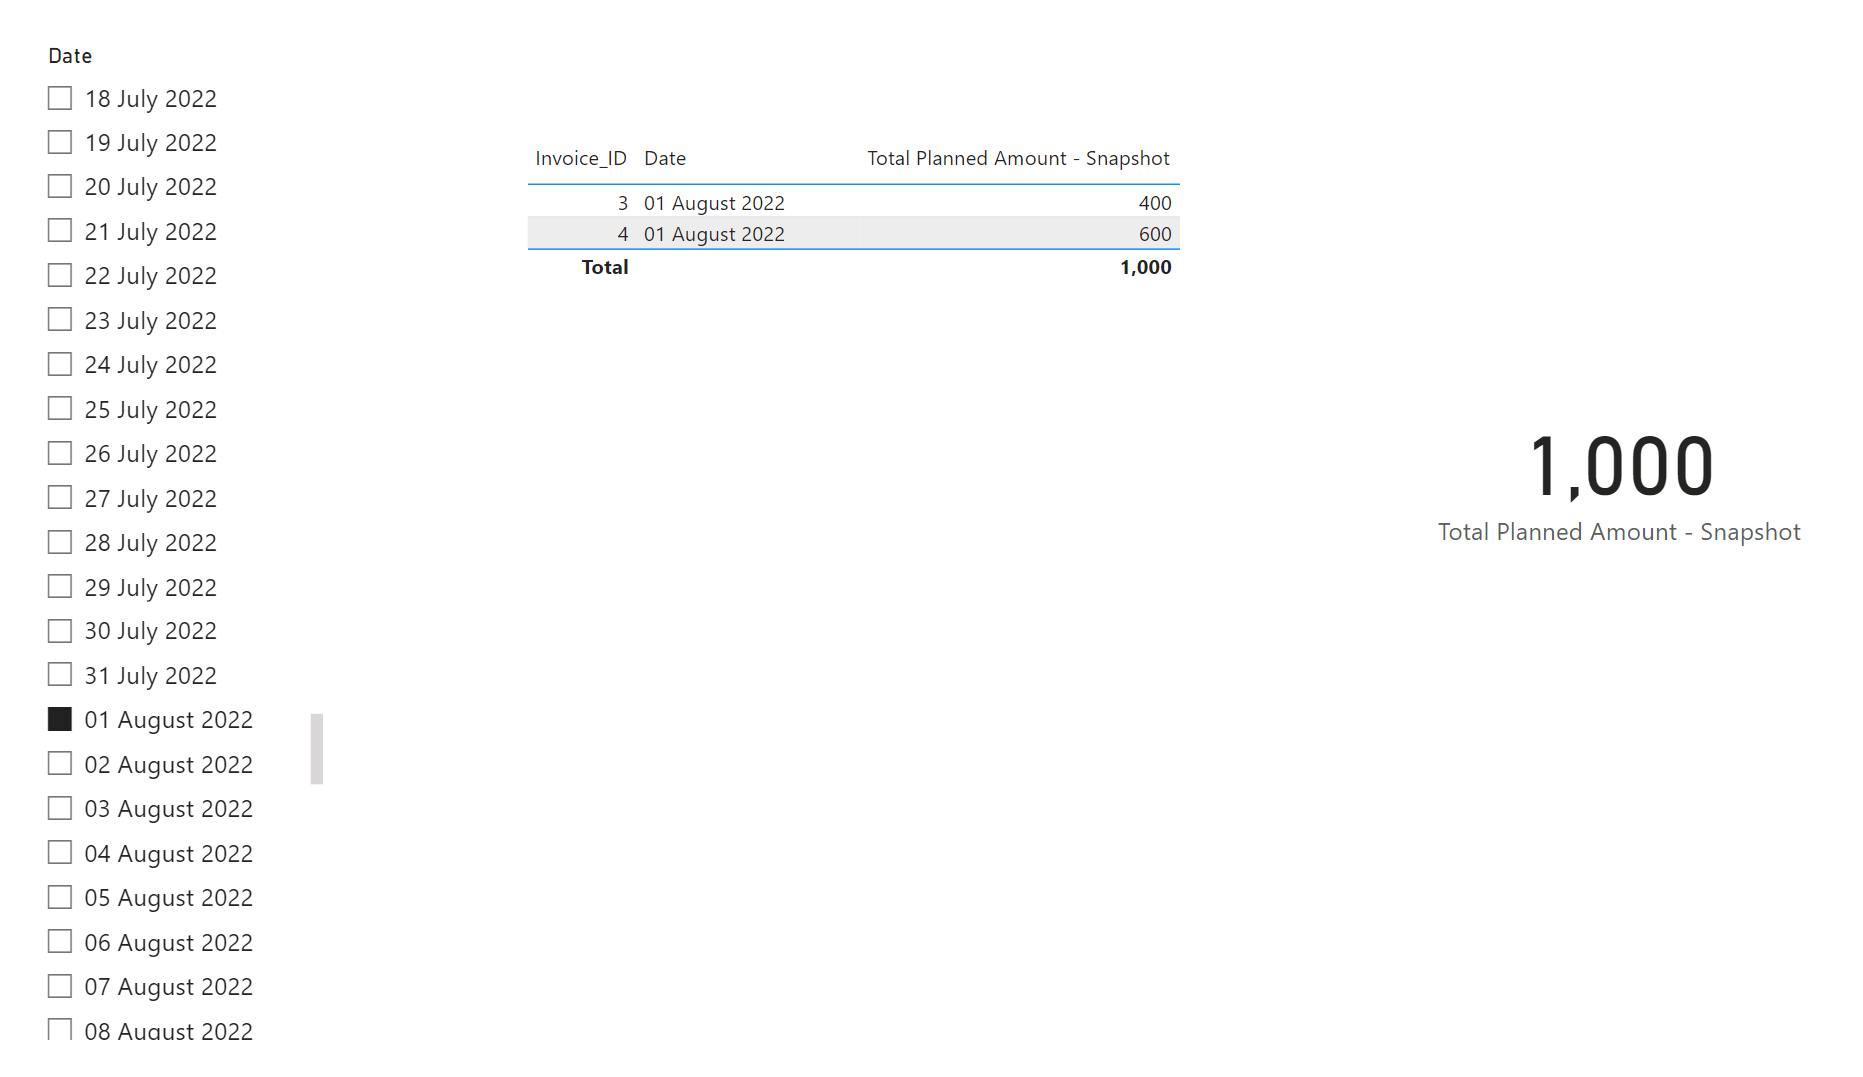
For e.g. if 01/08/2022 is selected on the filter, 1000 (400 + 600) will show as the total planned amount as the amounts included have dates that are closest to and on or before 01/08/2022 for both IDs (31/07 and 30/07). For filter date of 20/06/2022, the total planned amount would be 900 (200 + 700) as ID 3 has date 10/06/2022 which is before the 20/06/2022 and ID 4 has a date of 19/06/2022 ie the closest date to the filter that is on or before the filter date.

The date filter will be used to show the planned amount total at the point in time of the date selected. Is this possible?

thanks in advance.

Please add your work-in-progress Power BI Desktop file and source data in Excel format so that members of the Forum may understand the state including model, DAX, relationships, calendar table, and to be able to debug any measures or calculated columns suggested towards the logic of the question.

There are only two tables at the moment: one like the extract above and a calendar table joining on the date…

Hello @Seetal,

Thank You for posting your query onto the Forum.

Before proceeding further with the solution part, it’s our sincerest request that, please ensure that proper files are attached alongwith the description of the problem so that Forum members doesn’t have to invest their own time in creating the files in order to provide the assistance as it simply consumes their time. The members who provide their service onto the Forum, give up their own time to assist other members so please ensure that all requirements as per the Forum guidelines are met with while posting a query so that they can provide assistance in a better and efficient manner.

Coming to the solution part, based on the data, query and the scenario that you’ve posted, I’ve created a data model accordingly in my PBIX file. Below is the screenshot of the data model provided for the reference -

Now, write a DAX measure as provided below and alongwith that screenshot of the final results are provided for the reference purposes -

Total Planned Amount - Snapshot = 
VAR _vTable = 
SUMMARIZE(
    Planned , 
    Planned[Invoice_ID] , 
    Planned[Planned_Date] )

VAR _vColumn = 
ADDCOLUMNS(
    _vTable , 
    "@Total_Planned_Amount" , 
    CALCULATE( SUM( Planned[Planned_Amount] ) ) , 

    "@Next_Date" , 
    CALCULATE( MIN( Planned[Planned_Date] ) , 
        FILTER( ALLEXCEPT( Planned , Planned[Invoice_ID] ) , 
            Planned[Planned_Date] > EARLIER( Planned[Planned_Date] ) ) ) , 

    "@Day_Difference" , 
    IF(
        NOT ISBLANK( 
            CALCULATE( MIN( Planned[Planned_Date] ) , 
                FILTER( ALLEXCEPT( Planned , Planned[Invoice_ID] ) , 
                    Planned[Planned_Date] > EARLIER( Planned[Planned_Date] ) ) ) ) , 

        DATEDIFF(
            Planned[Planned_Date] , 
            CALCULATE( MIN( Planned[Planned_Date] ) , 
                FILTER( ALLEXCEPT( Planned , Planned[Invoice_ID] ) , 
                    Planned[Planned_Date] > EARLIER( Planned[Planned_Date] ) ) ) - 1 , 
            DAY ) , 

        DATEDIFF(
            Planned[Planned_Date] , 
            TODAY() , 
            DAY ) ) )

VAR _fTable =
UNION(
    FILTER(
        CROSSJOIN(
            VALUES( Dates[Date] ) ,
            FILTER( _vColumn , 
                [@Next_Date] <> BLANK() ) ) , 
        Dates[Date] >= Planned[Planned_Date] &&
        Dates[Date] <= [@Next_Date] - 1 ) , 
    FILTER(
        CROSSJOIN(
            VALUES( Dates[Date] ) ,
            FILTER( _vColumn , 
                [@Next_Date] = BLANK() ) ) , 
        Dates[Date] >= Planned[Planned_Date] &&
        Dates[Date] <= TODAY() ) )

VAR _Results = 
SUMX(
    _fTable , 
    [@Total_Planned_Amount] )

RETURN
_Results

I’m also attaching the working of my PBIX file for the reference purposes.

Hoping you find this helpful and meets your requirements that you’ve been looking for.

Important Note:- In the absence of your PBIX file, the results have been achieved based on the provided information in the query and therefore, you’ll be required to adjust the naming conventions of the fields and measure in your PBIX file accordingly.

Thanks and Warm Regards,
Harsh

Snapshot Amount - Harsh.pbix (136.7 KB)

1 Like

Apologies Harsh, as there were only a couple of tables thought it might be answerable for the snapshot. Will add any files in future.

Thanks for the dax solution. I’m a novice so will spend some time looking through and unpicking. May come back will any Qs if ok.

Sorry for the (long) delay in replying @Harsh , my report got paused and recently restarted. I have been going through the solution you provided and from initial testing looks like it might be just what I needed. However, I don’t understand a lot of it! I think I’ve worked out what the DAX means up to the _ftable but get lost on the crossjoin part onwards. I am familiar with crossjoin from SQL and wondered if you end up with some spare mins whether you’d be able to provide some comments/commentary on what all the variables are doing? Kind regards, Seetal