I think this is a revolutionary update because sometimes we need to create a “story mode infographic” report with less interactivity between visuals but, with to the point insights.
What do you think guys?
I think this is a revolutionary update because sometimes we need to create a “story mode infographic” report with less interactivity between visuals but, with to the point insights.
What do you think guys?
Hello @quantumudit,
Well yes totally agree with you my friend. 
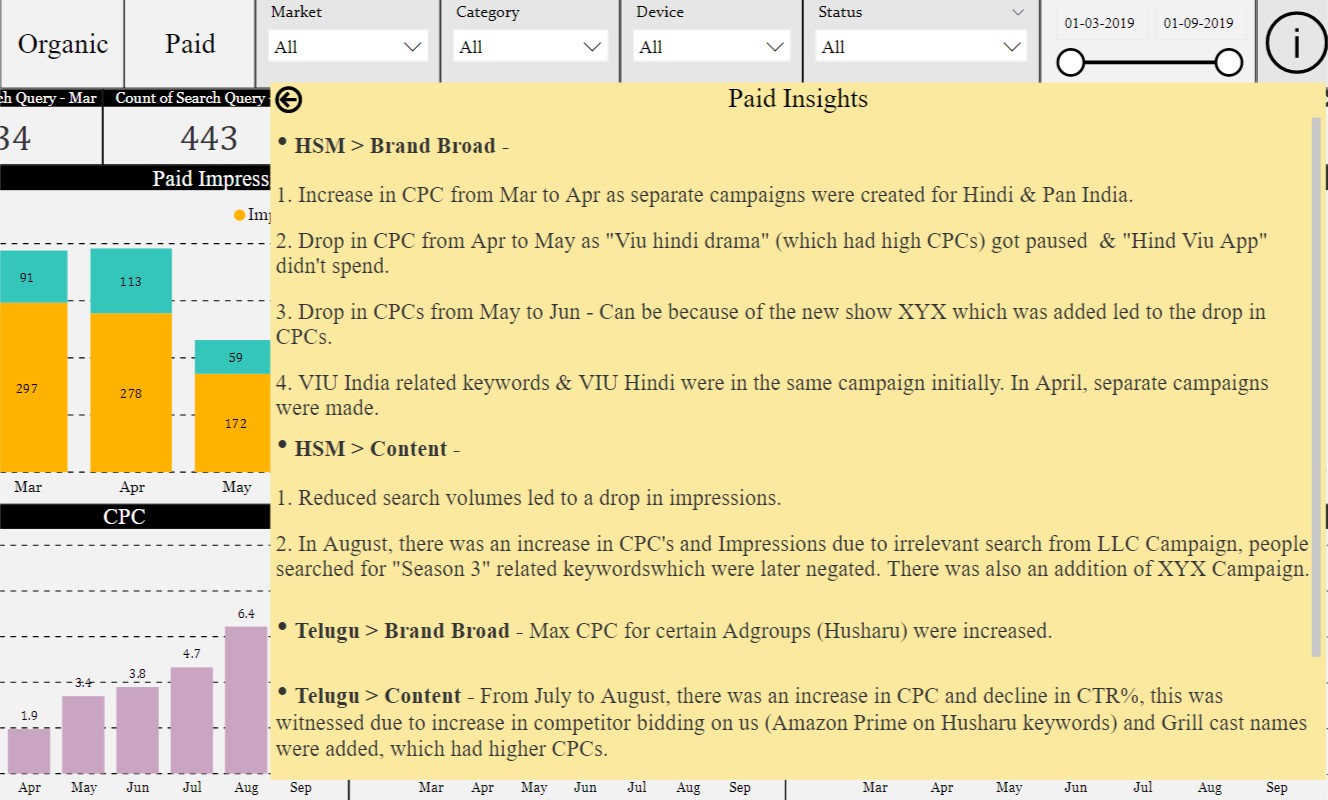
Some of my clients also wants to see the charts alongwith the explanations/narratives explaining how their campaigns are performing and what’s their growth over a period of time and all. Wherein the explanations/narratives change dynamically as per the slicer selection. Below is the screenshot provided for the reference -
Thanks and Warm Regards,
Harsh
Are smart narratives available yet? If so, where? I haven’t seen them yet, and AFAIK they are still a “future” enhancement to Power BI; to date I’ve been either using the Enlighten Data Story custom visual or making my own dynamic measures (with no formatting differences…). Greg
Hello @Greg,
The screenshot that I’ve attached in my case is of more that one year old dashboard where I’ve used dynamic measures and bookmarking techniques to make it more comprehensive and robust. But well yes, totally agree you that this new feature is still under the development and will certainly save lots of hours (atleast in my case).
I really hope this feature gets updated soon by the Microsoft Team.
Thanks and Warm Regards,
Harsh
Hi @quantumudit, a response on this post has been tagged as “Solution”. If you have a follow question or concern related to this topic, please remove the Solution tag first by clicking the three dots beside Reply and then untick the check box. Thanks!
New release of Power BI Desktop available now for September 2020 … includes Smart Narratives preview feature.
Demo video of new Smart Narratives feature (starts at 1:28).

@BrianJ Thanks for this. 
Yea this is a great new feature. Some amazing tech.
I agree. I’ve recently started using Enlighted Data Story for this purpose, following learning about it from @Greg’s Data Challenge entries. I thought that was a pretty nice custom visual, but the Smart Narrative feature is way more powerful.
Now, going to have to update my Data Challenge 7 entry… 
Hi Everyone,
Make sure you go to File …options and settings …options… Preview features and check mark Smart narrative visuals and click ok.
You will have to close/ shut down Power BI for the option to go into working order.
thanks
Keith
BI Elite has posted an example video you may find interesting:
 in Power BI")
thanks for posting that @Greg
Better get on with a video myself!
I remember a situation, where the client wanted to see the outcomes from the visuals and believe me, it was way more difficult to put a lot of text in a card visual, and with no left alignment option in cards, we need to import a custom card viz to do so…
But, guess what !! We are now going to replace them all with this smart narratives.
Just think of the many possibilities that we can achieve from this specific tool.
We can add emojis, custom texts, do a lot of formatting and really tell the stories out of our data.
Now, its just not about making interactive dashboard but, about getting insights, telling an impactful story that will definitely add value to the business.
Cheer on !! Power BI Nerds