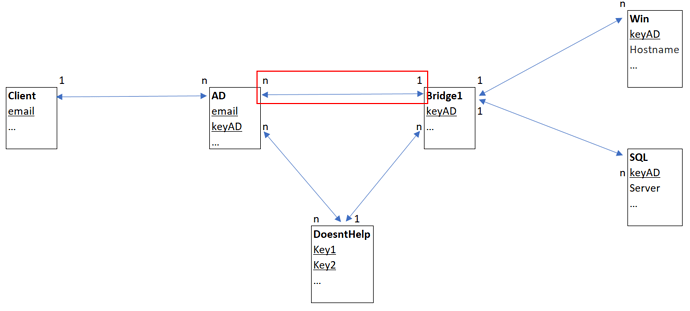
Hello, this is my 1st topic, and for today due to confidentiality i don’t have a PBIX neither data to send, but i think i have the MOC and the right information to share.
I’m trying to create a table that shows the Client that has the biggest number of Hostnames (in table Win). I want to do something similiar in table SQL but i’ll procede with the Win example.
Simply placing the email and a measure, this is painfully slow, like 50 minutes…
Test = CALCULATE(DISTINCTCOUNT(‘Win’[Hostname]),
CROSSFILTER(AD[Key_Not_Showing_onImage], DoesntHelp[key1], None),
CROSSFILTER(Bridge1[key_AD], DoesntHelp[key2] , None),
)
I was trying to do a SUMMARIZE, like this, but it doesn’t work, due to the fact that the relation between AD and Bridge1 is n to 1. Notice the red box.
Test = CALCULATE(
DISTINCTCOUNT(‘Win’[Hostname]),
SUMMARIZE(Client[email],AD[keyAD],Bridge1[key_AD],Win[key_AD]
CROSSFILTER(AD[Key_Not_Showing_onImage], DoesntHelp[key1], None),
CROSSFILTER(Bridge1[key_AD], DoesntHelp[key2] , None),
)
So, if i create a filter in Client, like in column Company (not shown), it is relatively quick.
Ideally, I would like to get the clients with the highest number of Win Hostnames, of all companies (not filtered by company).
How can i do this calculation be quicker? In a measure or in a “virtual table”? If it is in a virtual table how can i show it in Power BI?
I would love if someone can help me out, and also referring to me what are the trainings here on E-DNA that allows us to understand these type of DAX calculations.
Thanks in advance.


