Hello,
Is there way to have a slicer that you can move right or left to show items that exceed a threshold percent range.
For example, show items with costs that had 2% increase vs last year, then slide slicer to the right and show those items with costs above 8% increase vs last year.
Thanks
Brian
Yes definitely,
This would be just a simple ‘what if’ parameter.
See below
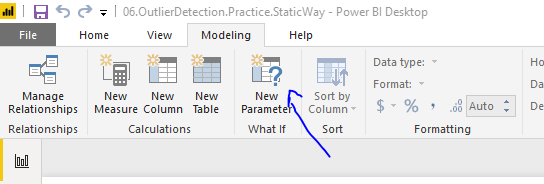
You then just need to work this parameter into your measures somehow.
The best material to use to understand how you integrate parameters like this is the Scenario Analysis Deep Dive course.
Thanks
Sam
Also check out this particular tutorial around threshold triggers.
There’s a bit to do around the formulas you need here as well.
I’ve made good progress since last week on scenario analysis using What if parameter. My last step is to suppress rows that do return a true condition.
For example. I set my variance threshold to 5%. It returns 3 rows with column populated with TY cost values which were 5% above LY cost values.
However., it also returns 6 rows with TY total cost value of blank since they were below the 5% threshold, which is correct but I do not want these 6 rows to appear on the report.
Is there way to suppress these rows?
Thanks
Brian
If you use BLANK() those rows shouldn’t be showing.
I would probably have to see some images or a model to advise further because I can’t quite picture everything at play just with the description.
Thanks
Sam
I will work some more tomorrow. Thanks
Hi Brian,
I like to work in Power BI. I basically do everything in here.
If setting something up to post can we add it as a pbix file, this way I can adjust and play around with solutions for you (and others)
You likely will just need to use a combination of CALCULATE and FILTER here.
Or potentially just COUNTROWS and FILTER. But it’s honestly different to say here and I don’t feel I’m seeing the whole picture.
As a guess,
You could write something like this.
CALCULATE( COUNTROWS( VALUES( ISAppColumn ) ),
       FILTER( ALL( App Table ) , LYMeasure > 800000 ) )
Thanks
Sam
Hi,
I resolved my DAX issue. I added a new VAR APP CNT measure to my visual and turned on subtotal to get count of apps that met the threshold criteria.
Thanks,
Brian