Hello @ERA965,
Thank You for posting your query onto the Forum.
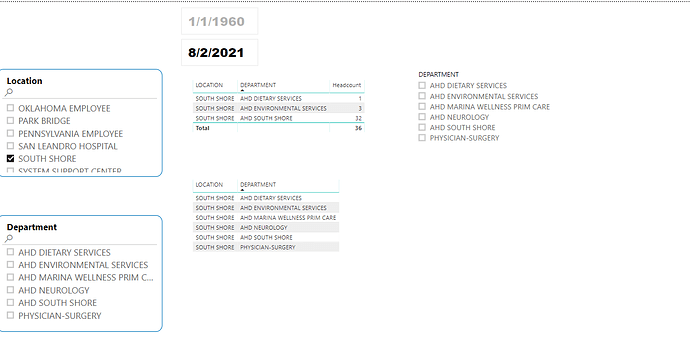
The reason why all the departments are being shown into the second table where no measure is placed is simply because there’re that many departments available under that particular location.
The slicer behaviour doesn’t simply changes just because you don’t have a value evaluated against that particular department. The thing is you’ve written your measure like this -
Headcount =
CALCULATE(
    SUM( 'All'[CNT] ) ,
        FILTER( 'All' ,
            [Withinrange] = 1 ) )
So by default this measure will provide you with the results where it satifies the condition and in case if the condition is not satisfied then it’ll simply replace them with the blank and those blank results will not be showcased. Now, this doesn’t mean that this measure has a direct effect over any of your slicer. That is, in case of “SOUTH SHORE” location only 3 departments are satifying the condition that you’ve mentioned in your measure. So therefore, it evaluated the results for those 3 departments and rest were ignored. Simple!!
But now if you write your measure like this -
Headcount =
VAR _Headcount =
CALCULATE(
    SUM( 'All'[CNT] ) ,
        FILTER( 'All' ,
            [Withinrange] = 1 ) )

RETURN
IF( ISBLANK( _Headcount ) ,
    0 ,
    _Headcount )
With this measure, now you’ll observe that there’re equal number of departments being showcased into the slicer as well as in both the table visuals. Below is the screenshot provided for the reference -
But as you suggested you only want to highlight the departments in the slicers that has values or rather that satifies your condition as mentioned into the measure than you’ll have to follow the steps as provided below -
-
Click onto the “Department Slicer” to activate that visual.
-
Drag the “Headcount” measure into the FILTER PANE.
-
Put the measure under the section - “Filters on this visual”.
-
Set the condition as - “is greater than 0”.
-
Click on “Apply Filter” button.
Now, if you see the departments slicer it’ll only showcase the department names against which conditions are satisfied as mentioned into the measure. So the number of departments showcased into the slicer is equal to the number of departments showcased/evaluated into the first table visual. Below is the screenshot of the result provided for the reference -
I’m also attaching the working of the PBIX file for the reference.
Lastly, I oberved that you’re following the “Flat File” concept into your data model rather than converting and optimizing it in the form of “Star Schema” model. One of our expert @Greg had alredy created a series of videos pertaining to the “Best Practices in Power BI” and I sincerely recommend you to go through those videos and convert your flat file into the optimized star schema model. Also you can go through the “Data Modelling and Transformation” course which is available onto our education portal. So it absolutely your choice whether to convert it or not but the method you’re following is absolutely not recommended. Below are the links of the videos as well as courses provided for the reference.
Hoping you find this useful and meets your requirements that you’ve been looking for. 
Conclusion: The measures only evaluate and provide the results within the context of the calculation. They don’t have any kind of direct effect over the slicers or filters.
Thanks and Warm Regards,
Harsh
Diversity EDNA model - Harsh.pbix (4.6 MB)


