I am building a “Simulation” model in Power BI. The business is implementing multiple projects over different business functions and locations.
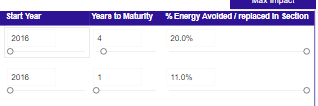
Each of these projects realizes different % improvement in the operations of the business. A project would have:
- a start year
- number of years until it realizes the max % improvement
- and % improvement (Savings) realized
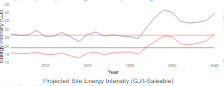
The organization wants to see the effect the changes in these 3 parameters for the different projects would have on the organization as a whole compared to projected outcomes should it implement no projects.
The problem is that we have 3 slicers per project. This makes it 200 + slicers that we “mine” data from which makes us run into serious performance issues. Can anyone suggest the best way to improve performance?
We look at:
- Yearly Energy used during normal operations
- Yearly % savings realized through implementing projects (A variable Calculated using the 3 slicers above )
Is there a way to populate a table from the slicers that can use the selectedvalue from previous/different pages? or use the calculated values from different report pages in a total impact page where put everything together?
Any help or suggestions would be greatly appreciated
@nico.swartz
One possible option would be to have a home page that is designated for slicers that adjust all, or any particular slide you wish. This way if a user only wanted to look at certain projects, they could use the slicer on the home page to adjust the other slides. This may not work in your situation, but putting it out for you to think about. Post some sample data in a PBIX file if you wish for us to further investigate options.
Thanks
Jarrett
You talk about multiple reports and each having 3 slicers. Are the slicers for each report the same, just needing different selections for each report? I have a report with 2 pages for report visuals, one containing just slicers, and another which consists of buttons for about 30 different reports. All reports pull from the same data and use the same visuals. I made all the required slicer selections for each report and created a bookmark to replicate them. Buttons on the home screen allow the user to select which report they want and use the associated bookmark so that each report is a one click affair. All the slicers are available to the user so they can experiment with modified criteria if desired.
No I have a report with about 200 slicers. Slicers on different report pages (For each site) but I need to bring all together to report on all the the projects for all sites. So I have 70 + projects and each project has 3 slicers.
I want to create input pages (Per Site) and then try and populate a table with the resultant values that I can read on a different page. - one page with 200 slicers is just incredibly slow.
This is exactly what I want to do. The problem is that in Power BI one cannot read a slicer value that is on a different report page. I can “sync” all slicers but this means that all ± 200 slicers is on the report summary page so that I can do the charts and cum total and variance charts. (Extremely slow)
The measures are simple where I have the energy consumption as per normal consumption, I have % savings realized through implementing different projects. So the saving achieved = the normal value x % saving/improvement.
The difficulty comes in that the % saving/improvement is calculated by using 3 slicer values per project implemented. (Selectedvalue from : the project start date, the number of years it takes to reach the max improvement % and the % savings realized by the project at maturity)
We want to see/simulate what happens on the overall impact for the whole business when these values change. (Projects starting later, different % improvements realized, etc.)
My question is exactly if anyone knows a way to have a input page per site and then on the report page be able to use the slicer values from this page (Without having to have the slicers on the reporting page) Hope you understand the issue.
Having a report where one read values from 200+ slicers (Using selectedvalue) makes it exceptionally slow and uses an incredible amount of RAM and processing power.
Thanks for posting your question @nico.swartz. To receive a resolution in a timely manner please make sure that you provide all the necessary details on this thread.
Here is a potential list of additional information to include in this thread; demo pbix file, images of the entire scenario you are dealing with, screenshot of the data model, details of how you want to visualize a result, and any other supporting links and details.
Including all of the above will likely enable a quick solution to your question.
Thanks to the contributors to this post. Due to the length by which this post has been active, we are tagging it as Solved. For further questions related to this post, please make a new thread.