I have simple sales analysis by salesperson, customer, and items. They are in separate frames and there aren’t any more space
But we have requirement to switch items I Items group | Items supplier in Items frame
It would be awesome that it will work like switch between sales Profit and Sales revenue in you sample Multi Thread Dynamic visuals http://prntscr.com/kirz27 . But problem, that SWITCH function allow to put in results only Measures, not Dimensions. Have you any ideas how to make slicer like this, for switching dimensions?
Can you add images of the scenario here and the problem your facing.
This should be simple to solve but I’m not understanding everything at play here.
I’m not really getting the ‘dimensions’ part of your query. With this technique you want the results to be in measures as the SWITCH statement returns the results.
The dimensions come from a supporting table that is created.
If you can elaborate with some images and formulas your currently using that would be helpful.
Just another though, are you just attempting to change which dimension fits into the slicer? I’ve just re-read and maybe that is what you need…
At the moment I’m not sure that this is truly possible actually.
I think that there is certainly visualization options and features you can use though that will get an effect just as good with less complication.
It will just be about positioning things well on your page and using make the bookmarks, toggles, slicers, and others. I just don’t think you want to over complicate things to much. That my view on it.
My report looks like this:
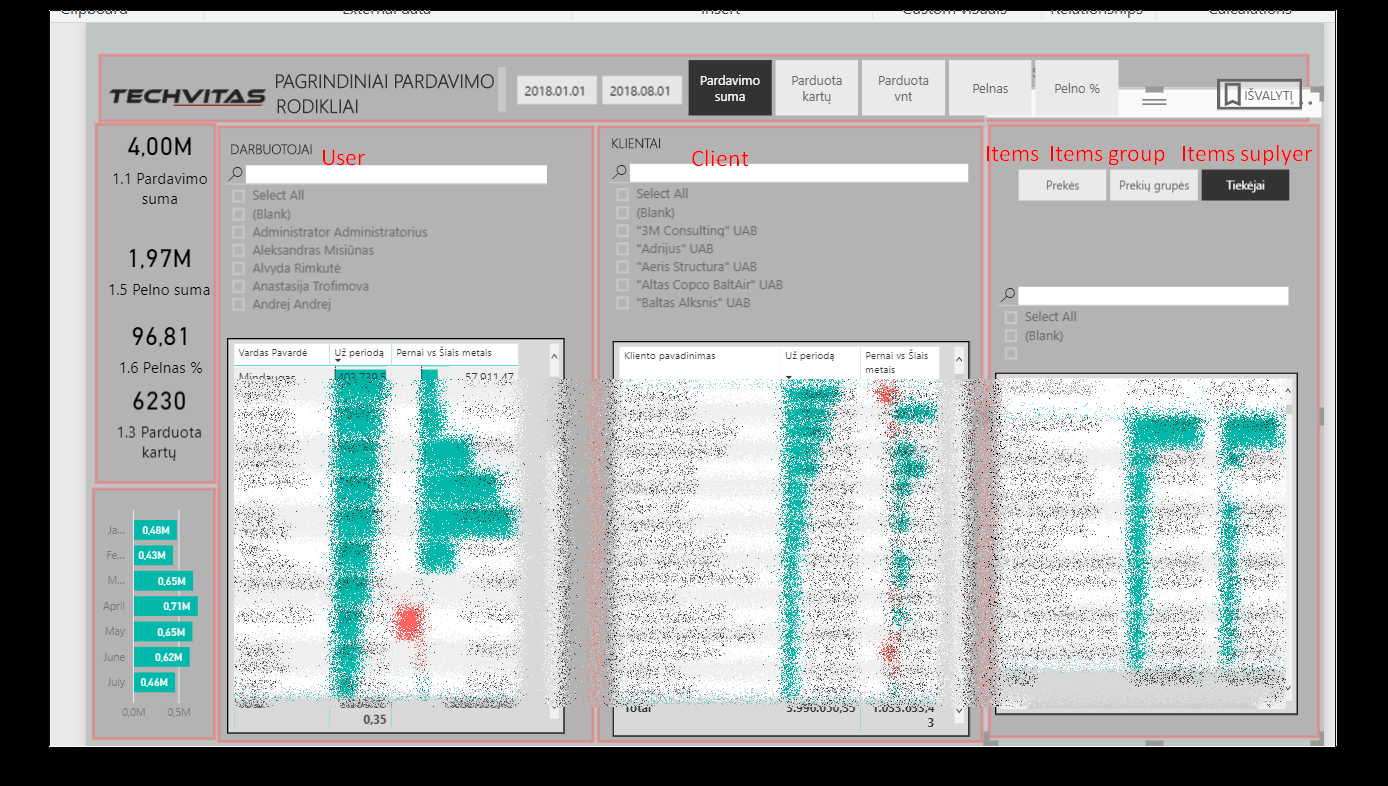
Sorry it is in pure Lithuanian language  I translate little bit.
You see in right there is frame with slicer ant table - Item || Item group || Item supplier
There is not enough space to fit it all, but customer needs to choose any of them.
Ok. I’ll try to do three slicer and three tables and put them back or forward and clear filters with bookmarks. It isn’t very good that bookmarks will clear any filters from other to frames - customer and users, but may be it best solution.
You know that you can change the way the slicer looks, say to a drop down? They may suit this more and look better also on your report page.
The slicer doesn’t only need to be a horizontal one. I use the dropdown version of the slicer a lot also.
Sam, I think You misunderstood me. Problem isn’t how slicer looks like. It’s easy to change it to drop down. But it dooesn’t solve my problem.
You see there is three frames - Users, Clients and Items. In each of them I have slicer for filtering and table with bars for showing data. I need to show left pane not only by items , but by Items groups, or by Items supplier. There isn’t enough space for three filtering slicers ant three tables.
Sorry for my bad english.
I solved it with to filtering slicer - by items group and item supplier and hierarchy matrix in Items (products) frame
Ok great. Thanks