Slicer for Ranks and Variance Measures

Hi ,

  1. I have created
    EDNA Clarification Slicer 04062022.xlsx (438 KB)

        (a) Variance MTD/QTD/YTD - Need to have Slicer to reflect respective Customer List. 
        (b) Ranks 1-10,11-20,21-30 so on.. - Need to have Slicer to reflect respective Customer List. 
    
  2. Attached file shows the measures , how can i generate Slicer from this.

Hi,

Can you provide the work in progress pbix it will very help full for the community member to help .

Thanks

Hi Anurag,

Pls. refer last 2 sheets Name CTC1A and RANKX
Division Performance_2_For Doubts.pbix (55.3 MB)

Hi,

Thanks for providing the pbix but your req is not clear to me can you .

Tell me what you wanna achieve here .

Thanks

Hi,

Want to populate the list of Customers where there is Variance for

Example - Variance
Battery Sales Variance
MTDs-1V
MTDs-1V is 16% - Can we populate Customers with Sales Value which is equivalent of -16%.

Example - Rank
Rank 1-10cs
Year 2022 is 37.3M - Can we populate Customers with Sales Value which is equivalent of 37.3M.

Hope above clarifies.

Hi,

For your rank one you need the below kind of chart:
image

Just create a measure like below and it work:

lets try = 
VAR min_rk=min('Customer Rank'[Min])
VAR max_rk=max('Customer Rank'[Max])
return
CALCULATE([S.Value],
          filter(VALUES(d_Customer_Code[Customer Name]),[Customer Ranking]>=min_rk && [Customer Ranking]<=max_rk))

let me know this what you want .

2nd part is still not clear can you share the expected output like you did for ranking.

Thanks

Thanks let me try above measure.
For Point 2 attached Excel File pls. refer Sheet 1 Battery this is the OUTPUT required for
Variance MTDs-1V - Example for Battery.
Report.xlsx (47.3 MB)

Hi Anurag ,

i copied above measure but not able to drag it in Slicer. Appreciate if you can share the file.

ok here is the pbix.
Division Performance_2_For Doubts.pbix (55.2 MB)

Thanks

Hi All,

Excel file for second requirement is uploaded , appreciate guidance pls.

Regards

bumping this post

Second requirement not answered, please.

Hi @Rohit1 - Please provide what are you looking to add in the Slicer.

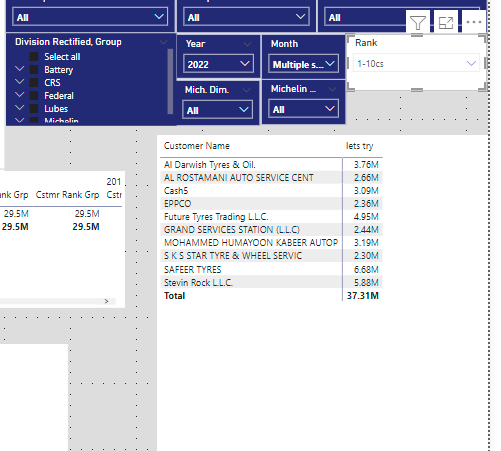
In the example provided in excel, -16% is calculated at Total level. This is not possible to include only those Customer that make up variance at Total level. We can only check at individual Row level.

If looking for something else, then please explain.

Thanks
Ankit Jain

EDNA Clarification 16062022.xlsx (19.0 KB)

Hi,

File attached , requirement highlighted in green color.

Regards

Hi @Rohit1 - What is the logic for showing List of Customers ?? If it is basis on Variance at Total Level as shown in example , then it is not possible. If it is at individual level i.e. only show customers with variance -16%, then it is possible and I can share Solution file.

Thanks
Ankit J

Hi Ankit,

Please share.

Regards

Hi @Rohit1 - Attached an example in “Variance” page, where we are only showing customers having Variance = -100. Similar can be done for other values.

Division Performance_2_For Doubts.pbix (55.2 MB)

Thanks
Ankit J

Hi @Rohit1,have you checked the suggestion of @ankit if it can help solve your query?

Hi @Rohit1, it’s been a while since we got a response from you. In case there won’t be any activity on it in the next few days, we’ll be tagging this post as Solved.

Hi @Rohit1, due to inactivity, a response on this post has been tagged as “Solution”. If you have a follow question or concern related to this topic, please remove the Solution tag first by clicking the three dots beside Reply and then untick the check box.