I am stuck with in a scenario , wherein i need to identify the list of users who have breached a particular criteria each month based on Start date and end date column.
Example if a person A has again breached a particular SLA , he needs to be highlighted which gives a impression to the end user that he had breached the SLA in previous month as well.I have created a calculated column Abuser list based on which i need to identify the user
I have attached the PBIX with Sample data.
Issue 2
Also i was trying to calculate the sum of particular value using the formula
Total OG Calls_Test = CALCULATE(SUM(Sheet1[TOT_OUTGOING_CALLS]),
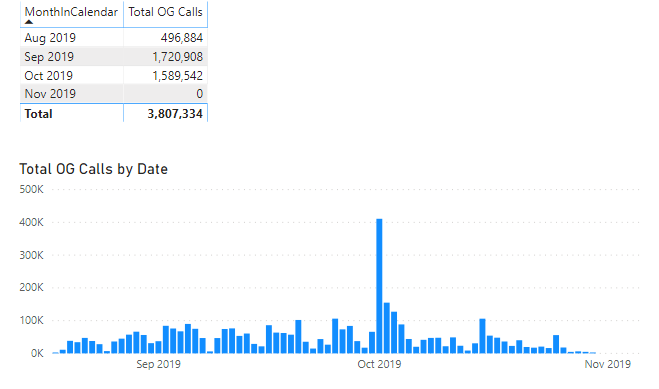
But some how when i select a particular calendar month it gives me wrong result.The number for each day is very high not sure whether is getting rolled up
@uriah1977 is correct. You need an active relationship between your Date table and your fact table for time intelligence functions to work correctly. In addition, you need to mark your Date table as a date table, and validate your Date field. For issue #2, all you need is your simple [Total OG Calls] measure. All your extra CALCULATE and FILTER statements are telling DAX to do is calculate over the range of your date table, which your simple measure will do once you make the changes above, and provide the proper evaluation context per the table below:
Per issue #1, I’m having a hard time figuring out what you’re looking for. Can you please provide a mockup of the result you want to see?
Thanks alot for all the quick responses , however I had done the calculation based on the single active relationship and the answer is coming correctly. But i saw one of the enterprise DNA video , wherein we can create the calculation over a range using the inactive relationships and the above DAX which is specified. i.e. filter and values. Using a single active relationship i am already getting values as said by @BrianJ.
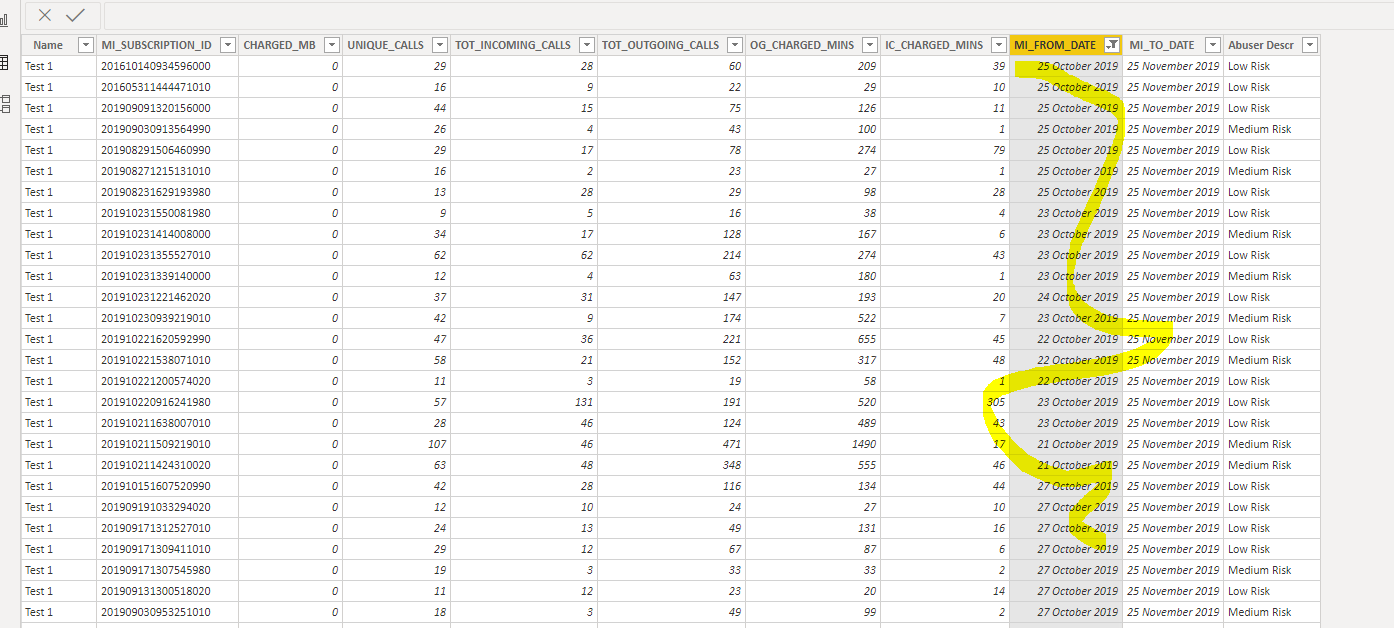
But what about the values which fall between october and November example screen shot provided . How to handle those records because currently with single active relation ship it showing them in the month of october only. And if at all user requirement is that want to exclude such values who have not completed the month cycle yet.
In my second requirement,
Basically I am planning to highlight only such records in a table visualization who have being high risk or medium risk , more than once previously i.e. lets say a person A was high risk in the month of June , July and August . Such users needs to be marked red , giving end user indication that this person was under high risk previously as well in the current month view.
For this what my plan is to write a dax of the format -
This measure is going to give me the count of rows based on Abuser descr and then output of this can be used in the conditional formatting in the current month view table visualization.
Thanks for the quick help, i did see this video before and base on that created the measure as required.
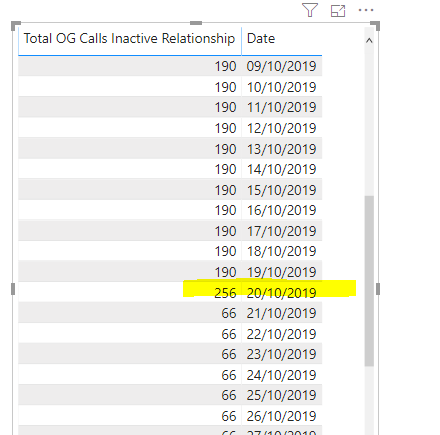
I am actually confused with the data that i have because in it for each row the start and end date over laps as a result of which using the above formula i get values summed up at that particular intersection of the dates i.e. see the screen shot below -
This is because the end date of one row is the start date for the 2nd row. I consider this to be the data issue and needs to be resolved in the source. then the formula suggested by you would work correctly.
What is your opinion on the same.