Hi Brian,
Maybe I should start by outlining the goal and purpose of creating this report and discuss the data structure I have created. Then, as you indicated, the problem could be the data model more than anything else. I am also sharing a sample pbix file. Here is detailed info on the project:
Goal: To fully automate and streamline QC Reports for each of the 95 Tables (Forms). The final report(s) will be refreshed with new data every quarter
Data Source: 95 SQL Tables. All Tables have different columns and different numbers of records. One common element among all Tables is Subject(ID).
QC Reports Templates: In a nutshell, although data varies by Tables (Forms), QC reports follow the same Template for all. This means, that there are certain visualizations for categorical variables such as Basic Matrix and perhaps Bar Charts. By the same token, for numerical variables, I have to present Box Plot. Of course, both Templates include various Filters, page navigations, etc.
Current Data Modeling: Since it will be too time-consuming, to work on each of the 95 Tables and create visualization and report one by one, I first divided the 100 Tables into Batches of 15 to 20 Tables (Forms) each. Then, in SQL Server, I LEFT joined the first 20 Tables with the Subject Master list and dumped the results into one single Table: dbo.QC_Report_Batch1. Then, I connected Power BI Desktop to the dbo.QC_Report_Batch1. I ended up having 500+ columns (variables). To streamline and follow the Templates (described above), I kept Subject (IDs) from each Table including Subject from the master Table, and Unipivot the rest of the columns into two columns (Batch1_Variable_List and Batch1_Data). So, Batch1_Variable_List includes all the variables, minus Subject, in all 20 Tables and Batch1_Data includes their corresponding values. Then, I joined this Table (QC_Report_Batch1) with an Excel File (Data Dictionary). The data dictionary includes all information on all columns (variables) in the 100 Tables. The info such as variable names, variable labels, value labels, and data type (Categorical, Numerical, DateTime, Text). So, by joining the two tables, I have now a single column (Data Type) where I can easily create the same Template say categorical Template for All variables that fall under categorical and do the same for numerical.
Sample PBIX file (QC First Batch Sample): The sample file I am sharing includes only two Tables (Forms). Please CTLR + Click on the Menu Button on the Top left to see Filters.
My Questions:
- Data Model: Is this data model suitable for the goal of the report(s)? my only concern is adding 15 to 20 tables with an average of 20 to 30 columns increasing the number of rows close to a million records! I have yet to gauge the performance but it’s definitely a concern.
- Alternative Model(s): Any other
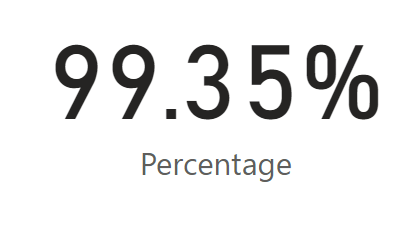
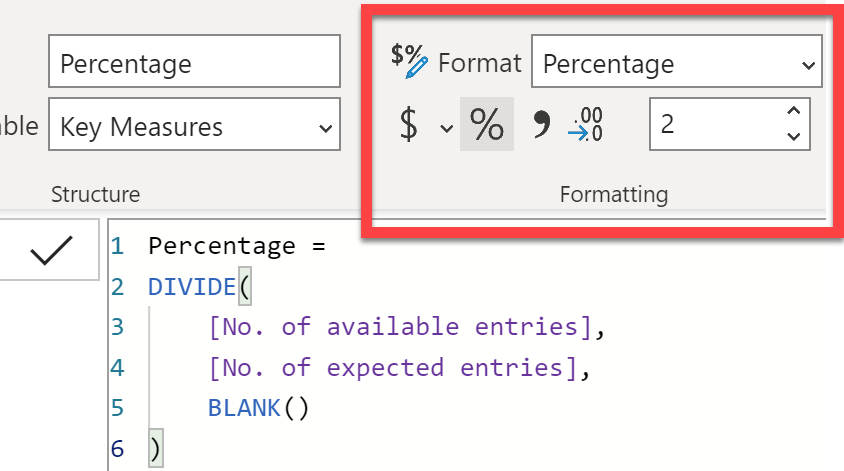
- Correct Calculations: Given the Unipovited structure of the data, what are the considerations for calculations? Example: Calculating the Percentage that I originally posted my question
Thank you,
Helal
QC First Batch Sample.pbix (1.7 MB)