Hi all,
I have created a Top 10 calculation and want to display the top 10 for various demographics within a chart utilizing the field parameter.
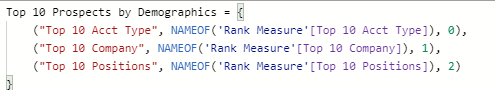
I have created a Dax formula to populate the Field parameter with the top 10 value:
Top 10 Parameters Field Prospects =
Calculate(
[Total Prospects],
FILTER(
Values(‘Top 10 Prospects by Demographics’[Top 10 Prospects by Demographics]),
IF(RANKX(
All(‘Top 10 Prospects by Demographics’[Top 10 Prospects by Demographics]),[Total
Prospects],DESC)
<=10, [Total Prospects], BLANK())))
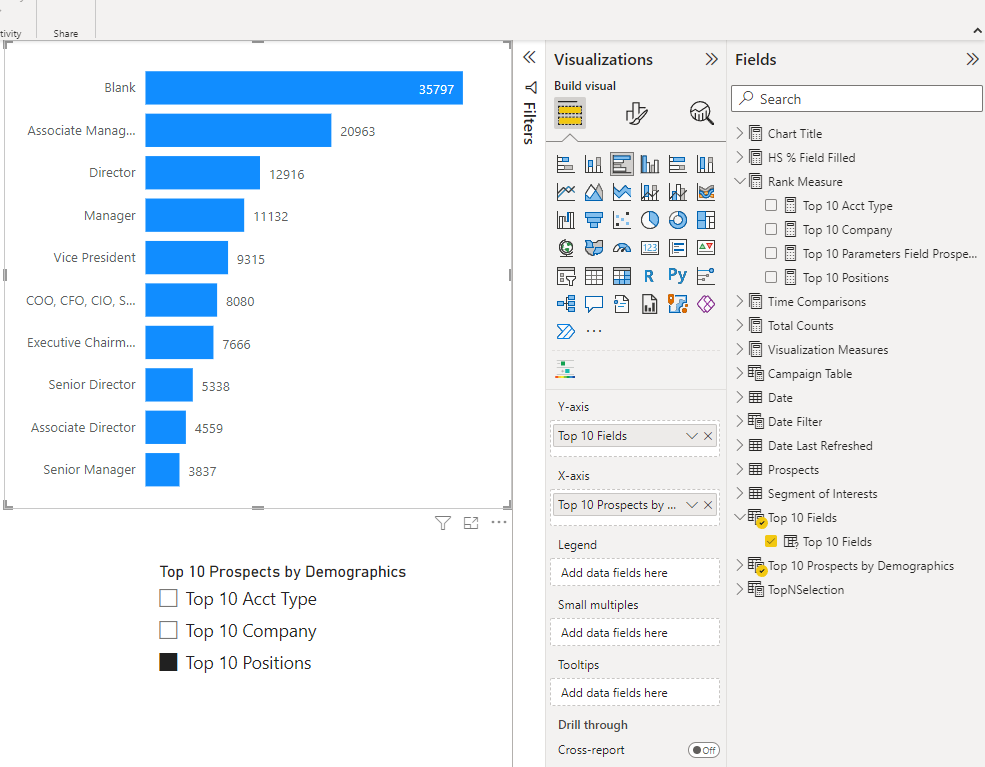
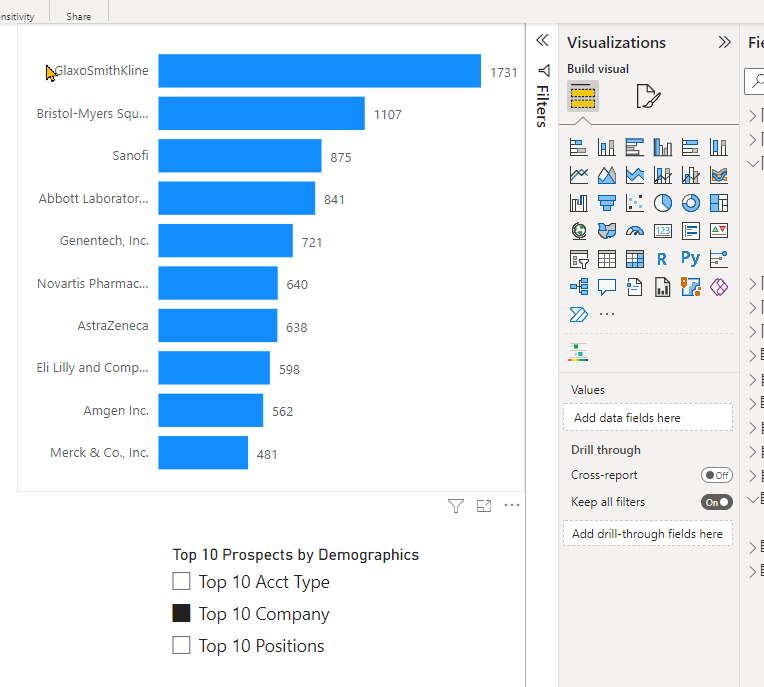
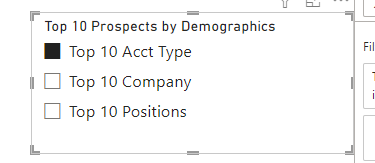
In my field parameter slicer I added the top 10 demographics that i wanted to trend:
- In my chart visuals for the y-axis, I added one of the demographic and in the x-axis, I added the Field Parameter measure*
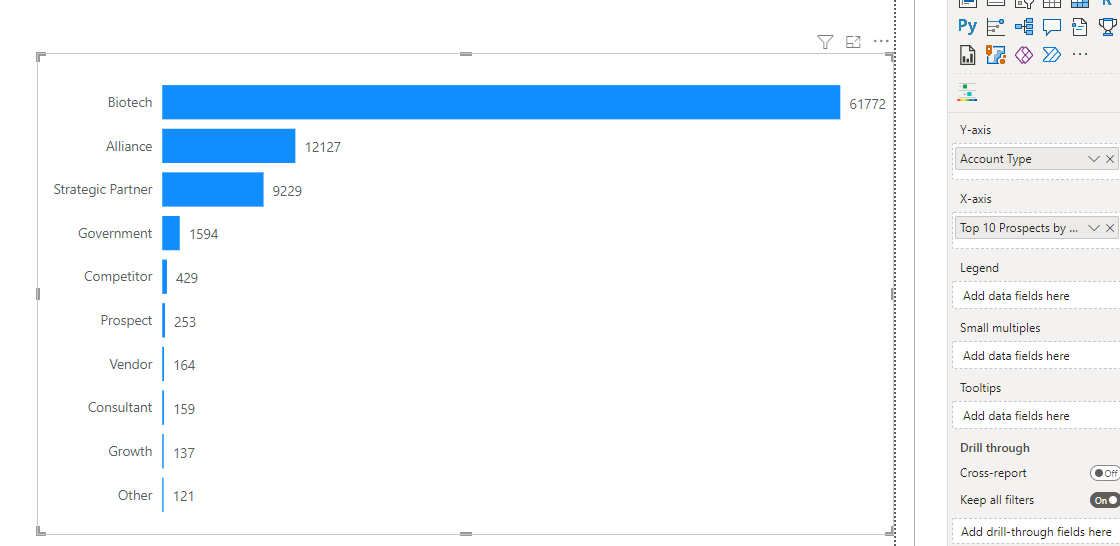
- When I tried to slice the visual, it is working but not showing the Top 10 only for the demographics in the y-axis. So when I select Top 10 Company it will show me all the company but not the Top 10 ,etc.
I hope I am making sense?
What am I doing wrong?
I have added the Working in Progress file and it is n the tab titled “Top 10”
Thank you for your help.
WIP File.pbix (11.1 MB)