Hi Fellow Power BI Users
Hope you are well. Here’s my issue and not sure how to work around it.
I have a Fact AR Outstanding Table which provides accounts receivable (AR) outstanding balances for each customer (account number):
Account Number | Invoice Date | Due Date of Receivable | Receivable Amount
I have created a measure (Customer Score) in DAX to score a customer based on past payments to anticipate future collection of receivables. At the end of the day, the output of this measure provides the number of days to add or subtract from the “Due date of Receivable” column. Hence a customer who, in the past, has paid before the due date will probably have a score of -5, which means subtract 5 from the due date to estimate when his current AR balance will be actually collected (forecasted).
What I need your help with is how to show a graph with the Receivable amount based on the estimated collection date (due date from Fact AR Outstanding Table + customer score measure). Hence, if in the Fact AR Outstanding Table, we have the following account number entry:
Account Number | Invoice Date | Due Date of Receivable | Receivable Amount
000032 | 8 Jun 2018 | 1 Aug 2018 | $30,000
And the customer score measure computes +20 for account number 000032, then the graph should show $30,000 on 21 Aug 2018 (Due Date of 1 Aug 2018 + Customer Score of 20). Would you know how to visually show this without the use of a calculated column for the estimated collection date? I can’t use a calculated column because the customer score measure is complex (uses ALLEXCEPT() and relates to another table.
I’m really trying to imagine every variable here but finding it difficult. I really would want to be able to see something, preferable test something.
Sorry I know it’s a detailed summary but there’s just too many variables for me to give a good answer right now.
There’s DAX and the context of the calculation to contend with. I would only be able to test by seeing.
Can you mock up a model and add it?
Thanks
I’m sure you can create this just with a measure and likely an iterating function, but as I say it’s too difficult to know what without testing it I feel. Thanks
Thanks Sam. Please refer to the pbix file I created in this attachment. It should help you understand the situation and context better.
Test Data.pbix (186.5 KB)
This one is quite interesting now that I can see the whole picture.
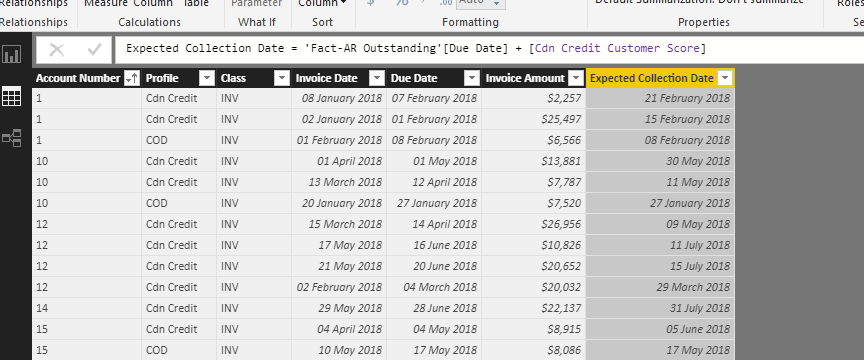
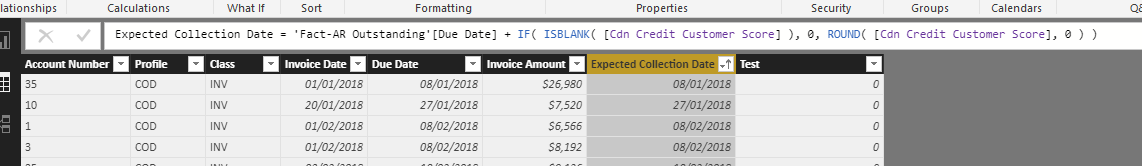
What I do think is you actually what the expected collection date to be in a calculated column.
Like so
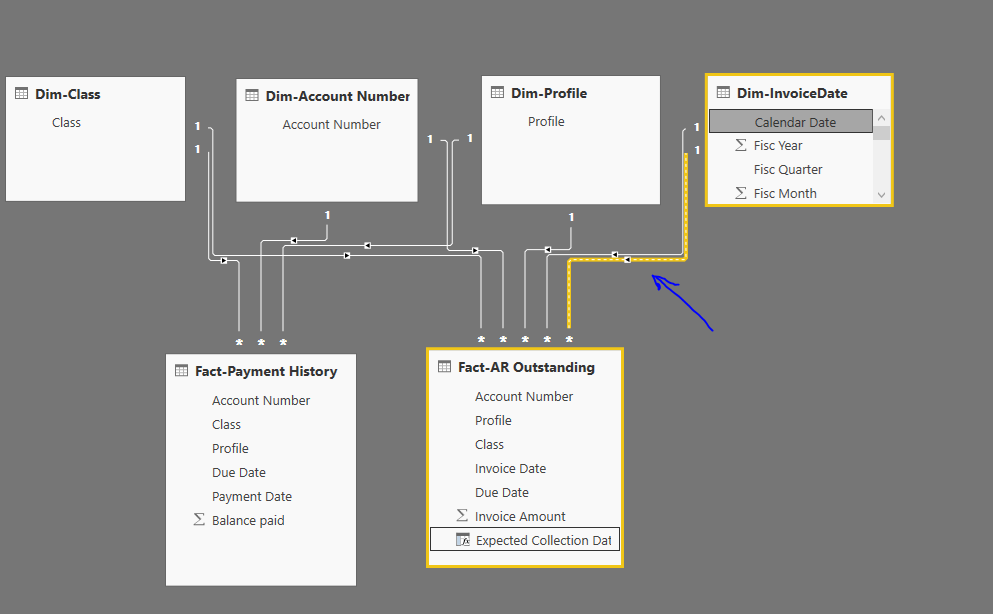
If you want to show this in a chart you really do need a dimension which has this date in it.
Then we need to solve the model problem with an inactive relationship down to this new column
Like this
With this we can then use the date column like normal and just turn on that relationship when needed
Collection Amounts =
CALCULATE( [Outstanding AR],
    USERELATIONSHIP( 'Dim-InvoiceDate'[Calendar Date], 'Fact-AR Outstanding'[Expected Collection Date] ) )
By using USERELATIONSHIP you now link up the date table to the Fact AR table via the new relationship (virtual one)
And can create this visual now with the weightings.
See how you go with this
Attached.
AR Collection example.pbix (184.5 KB)
Hi Sam! Apologies on the late reply and thanks for this solution.
I initially tried the calculated column approach but I can’t seem to understand why it works on the test dataset I provided to you and not on my dataset.
The measure [cdn credit customer score] used in the calculated column is as follows:
Cdn Credit Customer Score = //Finds the customer score based on the weighted average ((receipt date - due date) * invoice amount / total invoice amount) for each account with class "INV" and Credit profile "Cdn Credit". The output is a score that you can add to the due date of an outstanding AR balance to estimate collection date.
VAR TotalReceiptinAccount = //Gets the total of all transactions for each account. This is for "total invoice amount" in the formula.
    CALCULATE (
        [Total Receipts],
        FILTER(ALLEXCEPT (
            'Fact-Payment History',
            'Dim-Account Number'[Account Number]
        ), 'Fact-Payment History'[Profile] = "Cdn Credit" && 'Fact-Payment History'[Class] = "INV")
    )
RETURN  //finds customer score based on total amount above.
    SUMX (
        ADDCOLUMNS (
            FILTER(SUMMARIZE ( 'Fact-Payment History', [Account Number],[Due Date], [Payment Date], [Profile], [Class]),'Fact-Payment History'[Profile] = "Cdn Credit" && 'Fact-Payment History'[Class] = "INV"),
            "DateDiff", DATEDIFF ( [Due Date], [Payment Date], DAY ),
            "Invoice Amount", [Total Receipts],
            "Cumulative Total", TotalReceiptinAccount
        ),
        [DateDiff] * ( DIVIDE ( [Invoice Amount], [Cumulative Total] ) )
    )
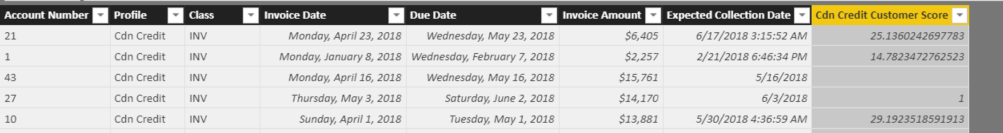
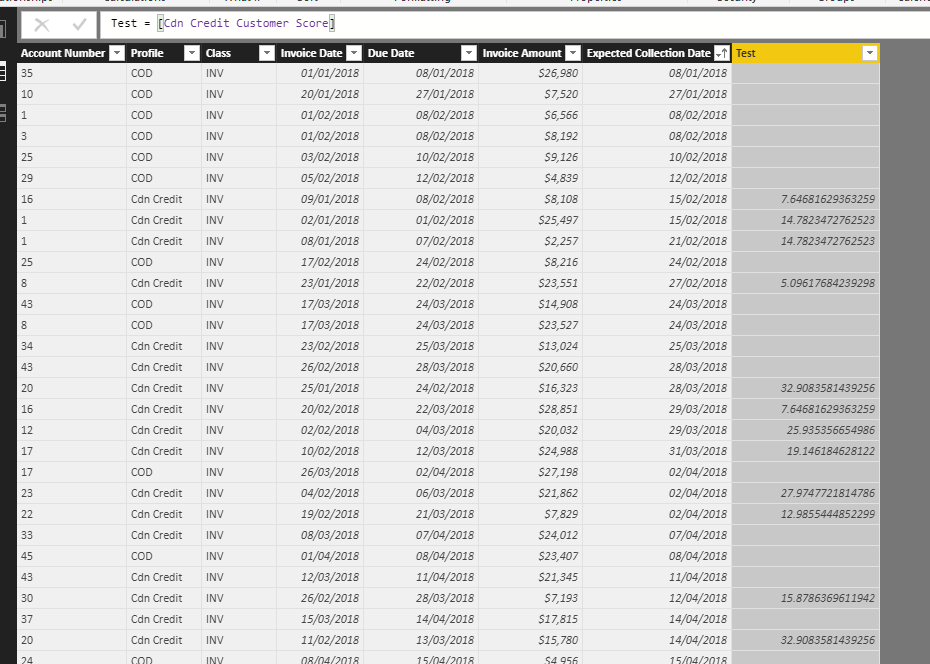
My formula above has an allexcept on a Dim-AccountNumber column and Fact-ARHistory table. I don’t understand how the Fact-AROutstanding table understands this code in the calculated column when the measure refers to a Fact-ARHistory table and Dim-AccountNumber column.
For example, below is a picture of the Fact-AROutstanding table. How does calculated column in the Fact-AROustanding table know to get the score for account number 21 from the Fact-ARHistory table when they aren’t even connected together bidirectionally?
I think I figured what was causing the issue in my actual dataset. The total receipts measure in the formula had a userrelationship piece and don’t think the calculated column liked that too much.
You were right in your multiple date videos. It’s important to label measures accurately. I should have a standard total receipts measure without userrelationship and another one “total receipts by invoice date” with userrelationship to tell the difference.
Thanks!
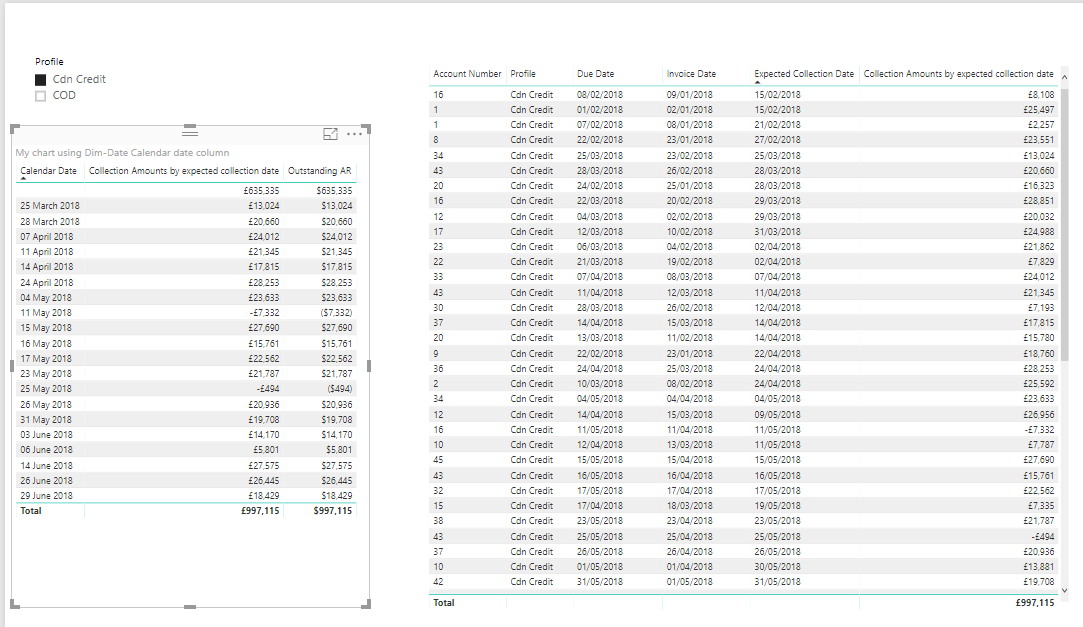
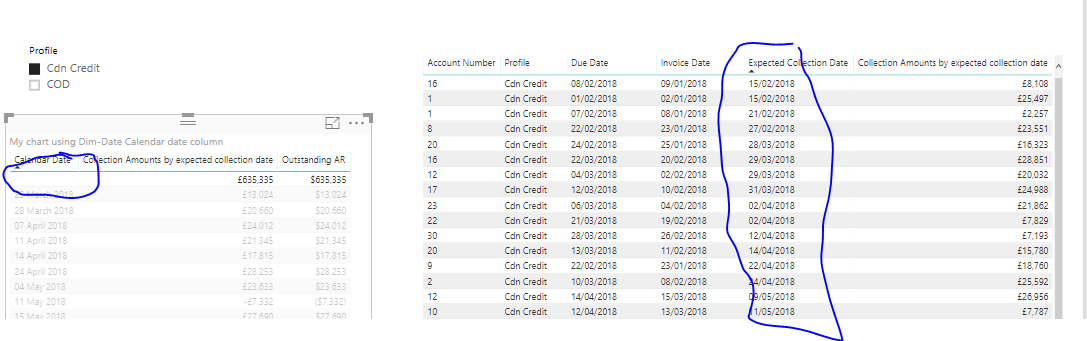
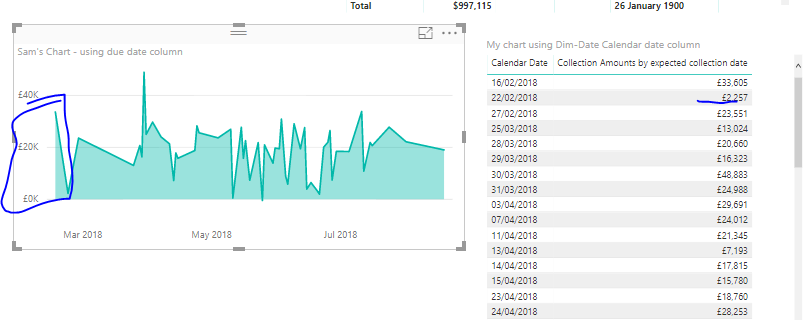
Hi Sam - Looking further at your blue chart in the above post and in the pbix file, I noticed that the userrelationship does not propogate on the visual.
In the attached file, here’s what I noticed:
For example: Account Number 1 has outstanding AR of $25K due Feb 1, 2018 and our calculated expected date shows that it will be paid off on Feb 15, 2018. The invoice date of the $25K is Jan 9, 2018.
In your visual, you used the Due Date from the Fact table and hence it shows that the Collection amount of $25K but it shows it’s due Feb 1, 2018 as opposed to Feb 15, 2018.
I created a separate visual using the Dim-Date, and now it gives weird results. The starting date of the visual is Mar 25, 2018 as opposed to Feb 15, 2018. If I changed the visual to a stacked column chart it shows me a value with a lot of blank dates. I don’t understand why it’s doing this. I would think user-relationship would work on the visual but it doesn’t. I think it’s maybe because the invoice date in the Fact-AROutstanding table has an active relationship with the date column.
At the end of the day, I just want to use a common date axis to show AR that’s due based on due date and AR that’s due based on the collection date in a visual. Could you please help with this?
AR Collection example.pbix (193.2 KB)
Sorry that’s my oversight if I have used the wrong dimension for the axis.
It should definitely come from the invoice date table as you’ve done.
This is quite odd.
I’m looking into it. I’ve been playing around with the behaviour and it doesn’t seem quite right, so doing some further investigating
Something is very bizarre with the data
I’ve been running some tests.
Even when I turn this relationship to active it still misses a range of dates (it’s like the dates just aren’t recognized)
This truly is weird.
I reckon it could be a data format or just plain data issue
But can’t really tell right at this moment.
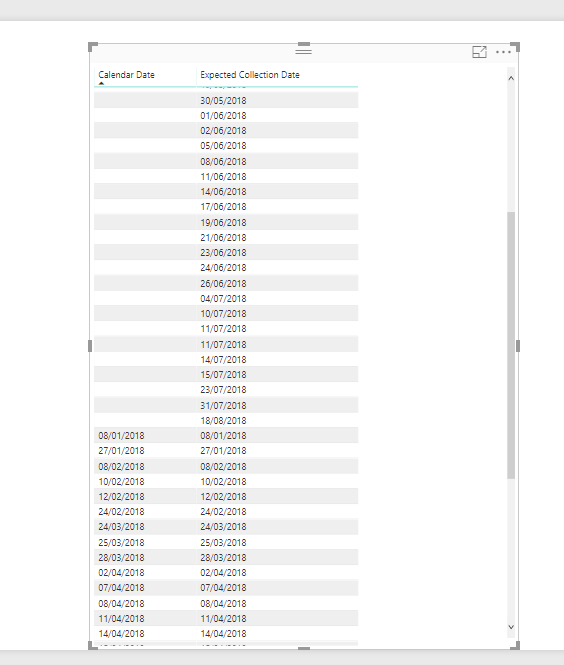
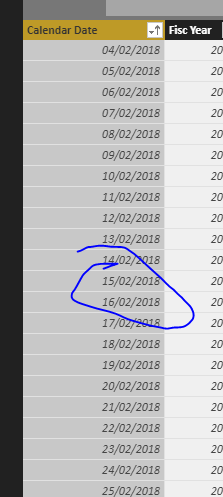
For example these dates just aren’t being picked up by the invoice table and calendar date column
I can’t really see why they are there in the calendar table
Then when I line them up in one chart they don’t even match.
This is very weird and suggests to me it’s something in the data for some reason.
My final thought is that it might be to do with this measure.
Cdn Credit Customer Score = //Finds the customer score based on the weighted average ((receipt date - due date) * invoice amount / total invoice amount) for each account with class "INV" and Credit profile "Cdn Credit". The output is a score that you can add to the due date of an outstanding AR balance to estimate collection date.
This looks to be why actually
See below
Let’s test something
Ok now it works!
That was an odd one, but think it’s solved now
Attached
AR Collection example 1.pbix (188.8 KB)
Thanks Sam. You are correct. I think it’s because for a couple of reasons that you addressed:
-
I was adding dates with a decimal number and even though on the surface it shows it as a regular date, PowerBI treats them as “decimal date”. Hence on a huge data set with expected collection dates of Aug 6, 2018 for example, it will actually give an error saying that there are many values for Aug 6, 2018 and hence trims the data on the visual to only a few amounts. So lesson learned here is to always add an integer to a date and never a decimal.
-
The second learning is that when you add BLANK() to dates, even though on the surface it shows dates, it seems like internally it treats the Date as a BLANK(). Hence the solution, as you correctly provided, is to replace the BLANK() with 0 and that should resolve the issue.
Once again, A HUGE THANK YOU for figuring this out!!!