Hi all,
I’m currently customising the ring chart made by Greg for Deneb, many thanks Greg, it’s a great starting point. I’m getting there but I’ve hit a slight impasse.
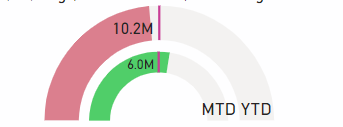
This is what my end result is trying to get to:
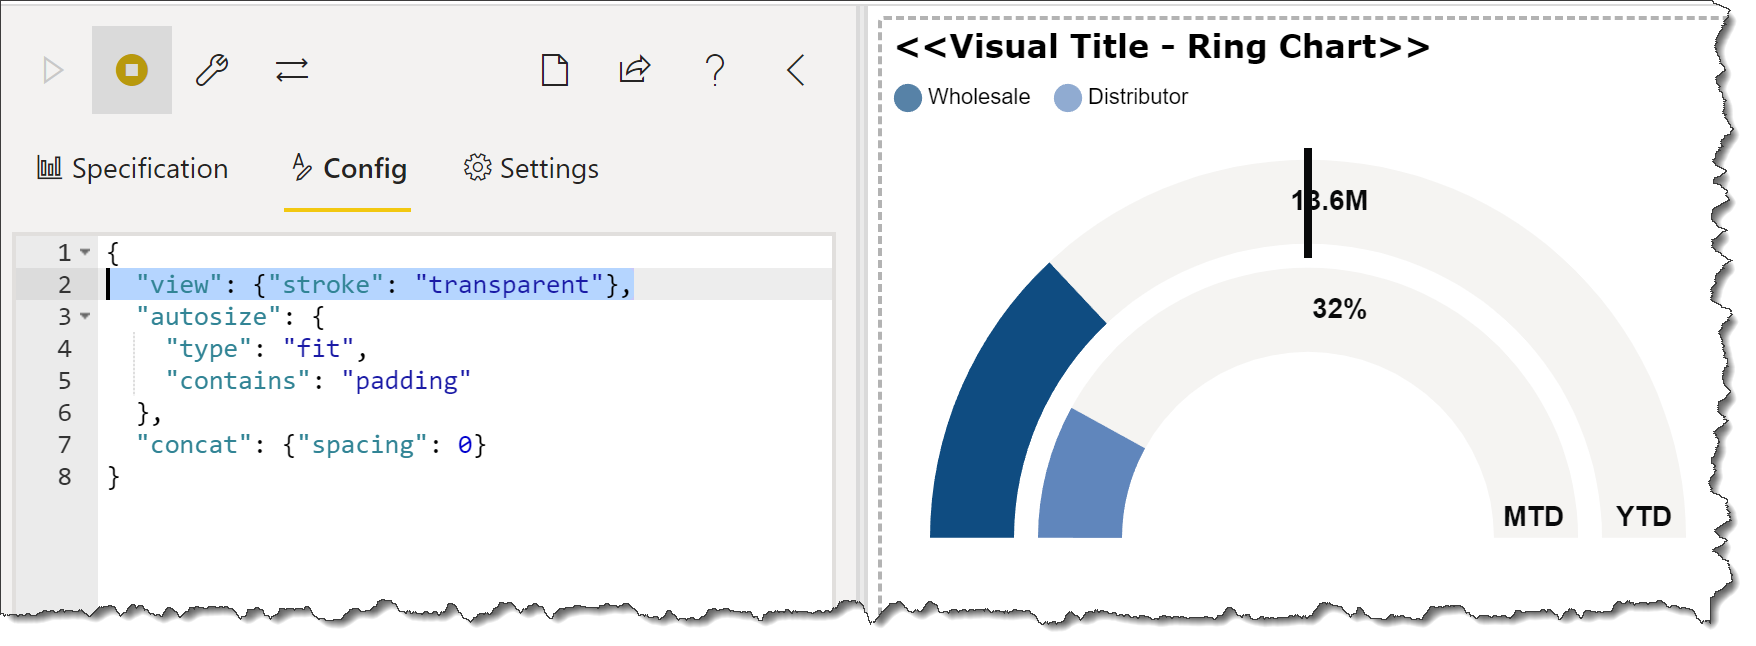
This is where I’m currently at:
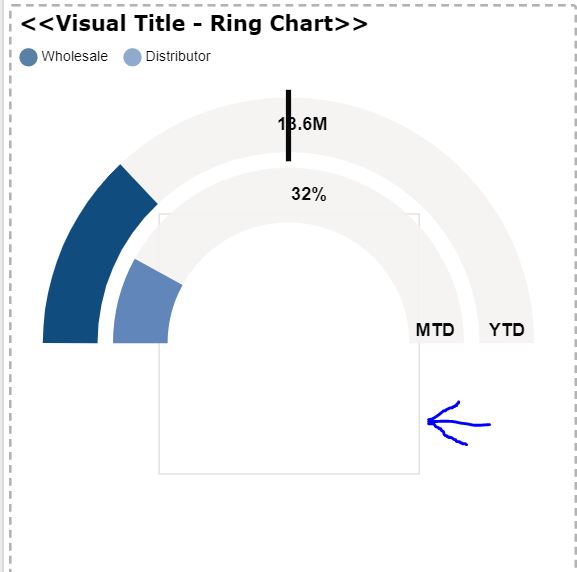
When attempting to emulate the halfway target vertical line I have added a mark “rule” but I now have this weird grey square in the middle of my visual (what the blue arrow is pointing to. I know it’s somehow caused by the “rule” mark (because removing the “rule” mark gets rid of the square) but I don’t know how to get rid of the pesky square.
I should be fine working on everything else for the visual, it’s just that square that is throwing me.
my pbi file is here:
Deneb Templates - Ring Chart (1).pbix (1.7 MB)
This is my “rule” mark:
{
“description”: “RING 1 (OUTER) TICK”,
“mark”: {
“type”: “rule”,
“strokeWidth”: 4
},
“encoding”: {
“x”: {
“value”: 100,
“axis”: null,
“scale”: {“domain”: [0, 10]}
},
“x2”: {
“value”: 100,
“axis”: null
},
“y”: {
“value”: -40,
“axis”: null
},
“y2”: {
“value”: -95,
“axis”: null
},
“stroke”: {
“value”: {
“expr”: “label_color”
}
}
}
}
and this is my complete code and pbi file, any assistance is appreciated
{
“description”: “An arc chart of 2 layered arcs with text labels”,
“title”: {
“text”: “<<Visual Title - Ring Chart>>”,
“anchor”: “start”,
“align”: “left”,
“font”: “Verdana”,
“fontSize”: 16,
“fontWeight”: “bold”,
“offset”: 10
},
“data”: {“name”: “dataset”},
“transform”: [
{
“calculate”: “((11.57datum.Ring1_Percent)/100)-1.57”,
“as”: “Ring1_Theta2”
},
{
“calculate”: “((11.57datum.Ring2_Percent)/100)-1.57”,
“as”: “Ring2_Theta2”
},
{
“calculate”: “((11.57datum.Ring3_Percent)/100)-1.57”,
“as”: “Ring3_Theta2”
},
{
“calculate”: "datum.Wholesale_Sales ",
“as”: “Ring1_Percent_Label”
},
{
“calculate”: “datum.Ring2_Percent + ‘%’”,
“as”: “Ring2_Percent_Label”
},
{
“calculate”: “datum.Ring3_Percent + ‘%’”,
“as”: “Ring3_Percent_Label”
}
],
“params”: [
{“name”: “ring_max”, “value”: 200},
{“name”: “ring_width”, “value”: 42},
{“name”: “ring_gap”, “value”: 12},
{
“name”: “ring0_color”,
“value”: “#F3F3F2”
},
{
“name”: “ring_background_color”,
“value”: “#F3F2F0”
},
{
“name”: “ring1_color”,
“value”: “#0F4C81”
},
{
“name”: “ring2_color”,
“value”: “#6086BC”
},
{
“name”: “label_color”,
“value”: “#08090A”
},
{
“name”: “ring_background_opacity”,
“value”: 0.9
},
{
“name”: “ring0_percent”,
“value”: 100
},
{
“name”: “ring0_outer”,
“expr”: “ring_max+2”
},
{
“name”: “ring0_inner”,
“expr”: “ring_max+1”
},
{
“name”: “ring1_outer”,
“expr”: “ring0_inner-ring_gap”
},
{
“name”: “ring1_inner”,
“expr”: “ring1_outer-ring_width”
},
{
“name”: “ring1_middle”,
“expr”: “(ring1_outer+ring1_inner)/2”
},
{
“name”: “ring2_outer”,
“expr”: “ring1_inner-ring_gap”
},
{
“name”: “ring2_inner”,
“expr”: “ring2_outer-ring_width”
},
{
“name”: “ring2_middle”,
“expr”: “(ring2_outer+ring2_inner)/2”
},
{
“name”: “ring3_outer”,
“expr”: “ring2_inner-ring_gap”
},
{
“name”: “ring3_inner”,
“expr”: “ring3_outer-ring_width”
},
{
“name”: “ring3_middle”,
“expr”: “(ring3_outer+ring3_inner)/2”
},
{
“name”: “circle_size”,
“value”: 200
},
{
“name”: “x_label_gap”,
“value”: 10
},
{
“name”: “x_circle_1”,
“value”: -100
},
{
“name”: “x_circle_2”,
“value”: -20
},
{“name”: “x_circle_3”, “value”: 60},
{
“name”: “x_label_1”,
“expr”: “x_circle_1 + x_label_gap”
},
{
“name”: “x_label_2”,
“expr”: “x_circle_2 + x_label_gap”
},
{
“name”: “x_label_3”,
“expr”: “x_circle_3 + x_label_gap”
}
],
“vconcat”: [
{
“description”: “LEGEND”,
“layer”: [
{
“description”: “CATEGORY 1 COLOUR”,
“mark”: {
“type”: “circle”,
“size”: {
“expr”: “circle_size”
},
“x”: {“expr”: “x_circle_1”},
“y”: 0,
“color”: {
“expr”: “ring1_color”
}
}
},
{
“description”: “CATEGORY 1 LABEL”,
“mark”: {
“type”: “text”,
“x”: {“expr”: “x_label_1”},
“y”: 0,
“align”: “left”,
“baseline”: “middle”
},
“encoding”: {
“text”: {
“field”: “Ring1_Category”
}
}
},
{
“description”: “CATEGORY 2 COLOUR”,
“mark”: {
“type”: “circle”,
“size”: {
“expr”: “circle_size”
},
“x”: {“expr”: “x_circle_2”},
“y”: 0,
“color”: {
“expr”: “ring2_color”
}
}
},
{
“description”: “CATEGORY 2 LABEL”,
“mark”: {
“type”: “text”,
“x”: {“expr”: “x_label_2”},
“y”: 0,
“align”: “left”,
“baseline”: “middle”
},
“encoding”: {
“text”: {
“field”: “Ring2_Category”
}
}
}
]
},
{
“description”: “RINGS”,
“layer”: [
{
“layer”: [
{
“description”: “RING 1 (OUTER) BACKGROUND”,
“mark”: {
“type”: “arc”,
“radius”: {
“expr”: “ring1_outer”
},
“radius2”: {
“expr”: “ring1_inner”
},
“theta”: -1.57,
“theta2”: 1.57
},
“encoding”: {
“color”: {
“value”: {
“expr”: “ring_background_color”
}
},
“opacity”: {
“value”: {
“expr”: “ring_background_opacity”
}
}
}
},
{
“description”: “RING 1 (OUTER)”,
“mark”: {
“type”: “arc”,
“radius”: {
“expr”: “ring1_outer”
},
“radius2”: {
“expr”: “ring1_inner”
},
“theta”: -1.57,
“theta2”: {
“expr”: “datum.Ring1_Theta2”
},
“cornerRadius”: 0
},
“encoding”: {
“color”: {
“value”: {
“expr”: “ring1_color”
}
},
“tooltip”: [
{
“field”: “Ring1_Category”,
“type”: “nominal”,
“title”: “Channel”
},
{
“field”: “Ring1_Percent_Label”,
“type”: “nominal”,
“title”: “Percent of Total Sales”
}
]
}
},
{
“description”: “RING 1 (OUTER) LABEL”,
“mark”: {
“type”: “text”,
“align”: “right”,
“baseline”: “middle”,
“dx”: 30,
“dy”: {
“expr”: “-1ring1_middle"
},
“fontSize”: 14,
“fontWeight”: “bold”
},
“encoding”: {
“text”: {
“field”: “Ring1_Percent_Label”,
“type”: “nominal”,
“format”: “.3s”
},
“color”: {
“value”: {
“expr”: “label_color”
}
}
}
},
{
“description”: “RING 1 2nd (OUTER) LABEL”,
“mark”: {
“type”: “text”,
“align”: “right”,
“baseline”: “middle”,
“dx”: 182,
“dy”: -10,
“fontSize”: 14,
“fontWeight”: “bold”
},
“encoding”: {
“text”: {
“value”: “YTD”,
“type”: “nominal”,
“format”: “.3s”
},
“color”: {
“value”: {
“expr”: “label_color”
}
}
}
},
{
“description”: “RING 1 (OUTER) TICK”,
“mark”: {
“type”: “rule”,
“strokeWidth”: 4
},
“encoding”: {
“x”: {
“value”: 100,
“axis”: null,
“scale”: {“domain”: [0, 10]}
},
“x2”: {
“value”: 100,
“axis”: null
},
“y”: {
“value”: -40,
“axis”: null
},
“y2”: {
“value”: -95,
“axis”: null
},
“stroke”: {
“value”: {
“expr”: “label_color”
}
}
}
}
]
},
{
“layer”: [
{
“description”: “RING 2 (MIDDLE) BACKGROUND”,
“mark”: {
“type”: “arc”,
“radius”: {
“expr”: “ring2_outer”
},
“radius2”: {
“expr”: “ring2_inner”
},
“theta”: -1.57,
“theta2”: 1.57
},
“encoding”: {
“color”: {
“value”: {
“expr”: “ring_background_color”
}
},
“opacity”: {
“value”: {
“expr”: “ring_background_opacity”
}
}
}
},
{
“description”: “RING 2 (MIDDLE)”,
“mark”: {
“type”: “arc”,
“radius”: {
“expr”: “ring2_outer”
},
“radius2”: {
“expr”: “ring2_inner”
},
“theta”: -1.57,
“theta2”: {
“expr”: “datum.Ring2_Theta2”
},
“cornerRadius”: 0
},
“encoding”: {
“color”: {
“value”: {
“expr”: “ring2_color”
}
},
“tooltip”: [
{
“field”: “Ring2_Category”,
“type”: “nominal”,
“title”: “Channel”
},
{
“field”: “Ring2_Percent_Label”,
“type”: “nominal”,
“title”: “Percent of Total Sales”
}
]
}
},
{
“description”: “RING 2 (MIDDLE) LABEL”,
“mark”: {
“type”: “text”,
“align”: “right”,
“baseline”: “middle”,
“dx”: 30,
“dy”: {
“expr”: "-1ring2_middle”
},
“fontSize”: 14,
“fontWeight”: “bold”
},
“encoding”: {
“text”: {
“field”: “Ring2_Percent_Label”,
“type”: “nominal”
},
“color”: {
“value”: {
“expr”: “label_color”
}
}
}
},
{
“description”: “RING 2 2nd (OUTER) LABEL”,
“mark”: {
“type”: “text”,
“align”: “right”,
“baseline”: “middle”,
“dx”: 128,
“dy”: -10,
“fontSize”: 14,
“fontWeight”: “bold”
},
“encoding”: {
“text”: {
“value”: “MTD”,
“type”: “nominal”,
“format”: “.3s”
},
“color”: {
“value”: {
“expr”: “label_color”
}
}
}
}
]
}
]
}
],
“view”: {“stroke”: null}
}