My apologies if this question should be in a different forum, but I figured I post it here as it’s a piggyback off of my previous question about due dates.
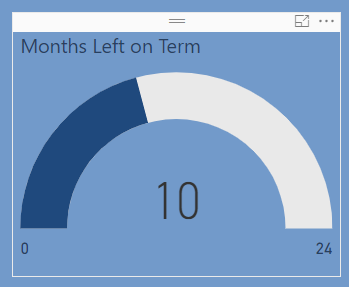
Now that I have my start date + terms = due date working (huge thanks, Sam), I was asked if it’s possible to show a progress bar to visualize the time left from start date to due date.
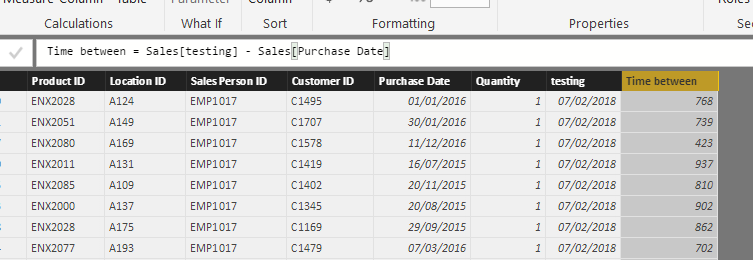
I found a custom linear gauge that I can utilize for the visualization part. Now I need to figure out how to convert the time between the start date and due date as an integer for the value, target value, max, etc. I hope I am making sense with my explanation.
Converting getting the days to due date shouldn’t be difficult.
I’ve mocked up a quick example. Just use the dates you already have, you’ll probably have to add a column or just the formula of TODAY().
On the progress bar. I’m not too sure what you mean there.
I mean you can likely work out like the % of completion by going
due date - start date = term length
days to due date / term length
Something like this. Hopefully this gets you started atleast
1 Like
Sam,
Thanks again for your guidance. I got it working using your suggestions. I ended up using just the built-in gauge visualization.
Ok great. Glad you’ve got a solution