Hi,
My Report has date_dim and benefits_fact table which has measure benefits along with Year & Month columns
I have three pages report with different views(hard coded filters of other dimensional columns). I have Year slicer from date dimension on all three pages and sync is in tact when one slicer is selected in any page all of them pages filters by selected year. In one of the pages, I have a bar chart which needs to displayed with selected year and plus 3 future years … For example if year 2020 is selected then I need to show 2020,2021,2022,2023 and if year 2021 is selected I need to show 2021,2022,2023,2024.
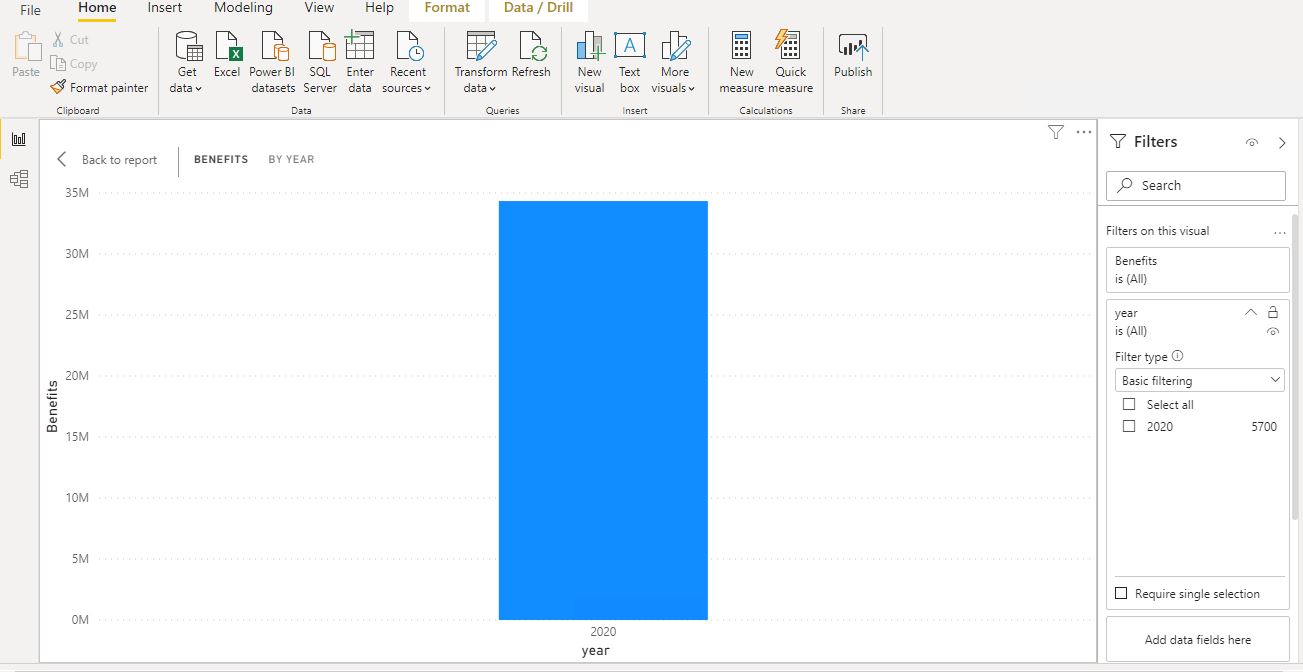
Impact of SlicerSelection on Visual
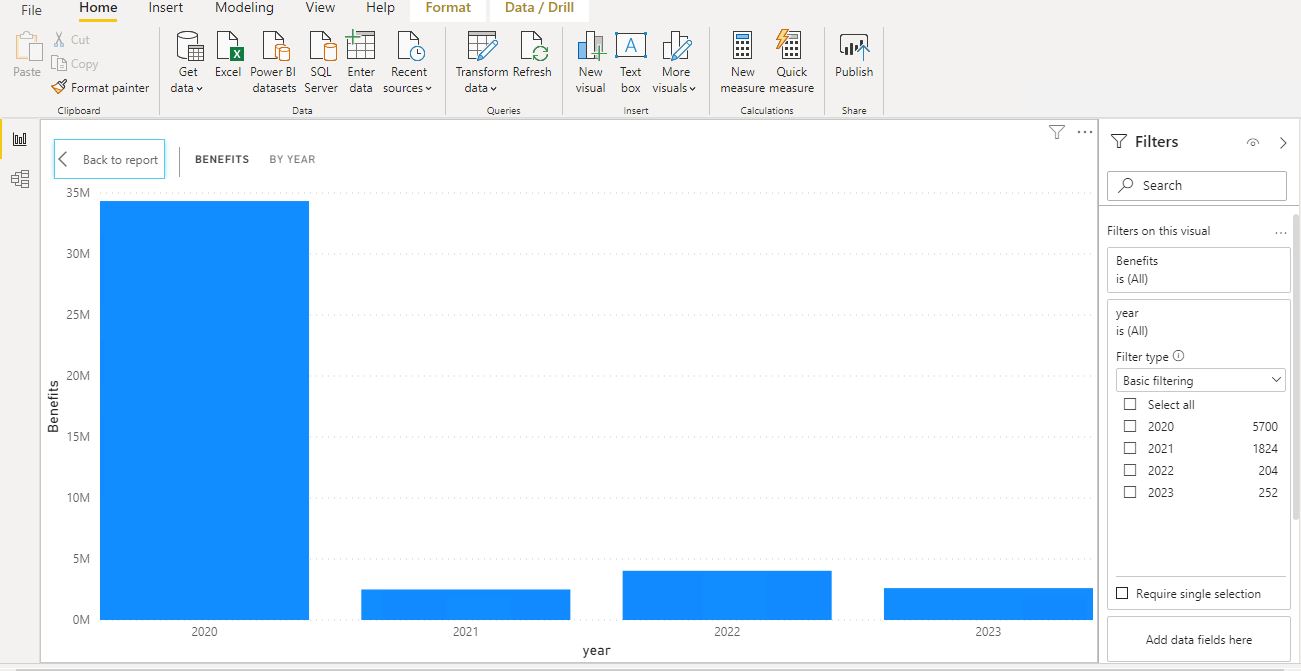
Desired Result with Slicer Selection
How can I achieve this via DAX . Please help or guide me with an approach
PS : I have gone through disconnected table method however in my scenario I want to keep all the slicer across all pages in Sync so it does not serve the need.
Thanks
Jayden
