Hi Community, I hope you are all doing great,
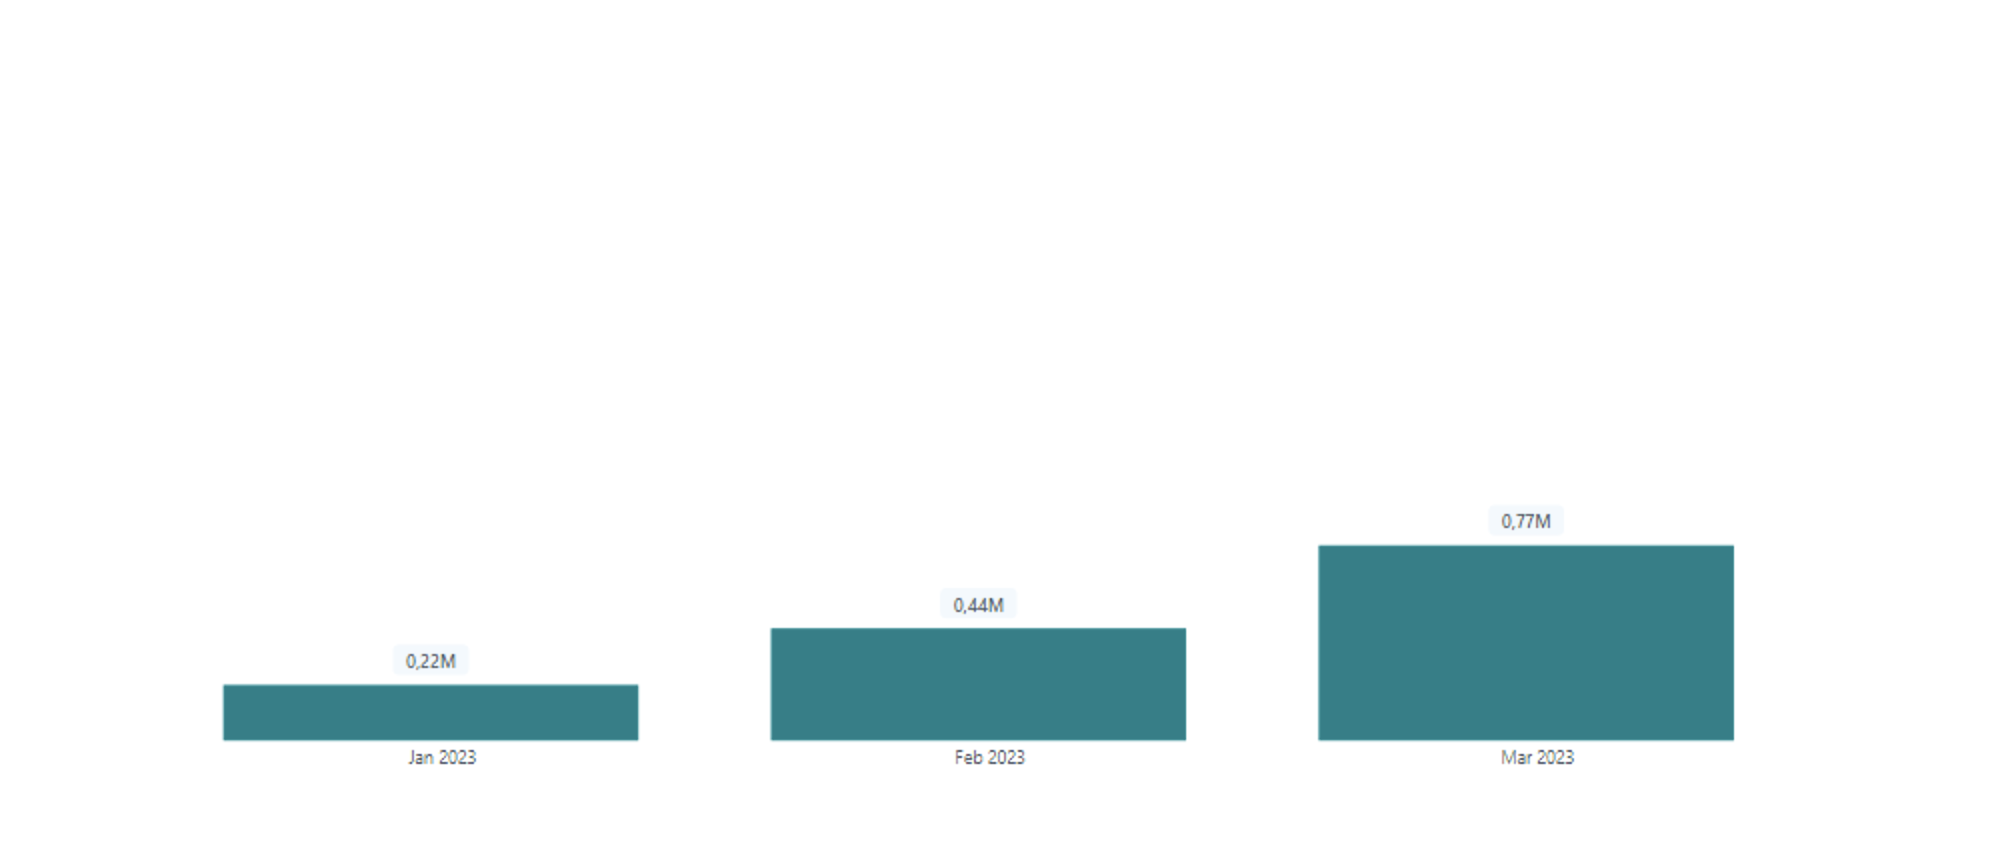
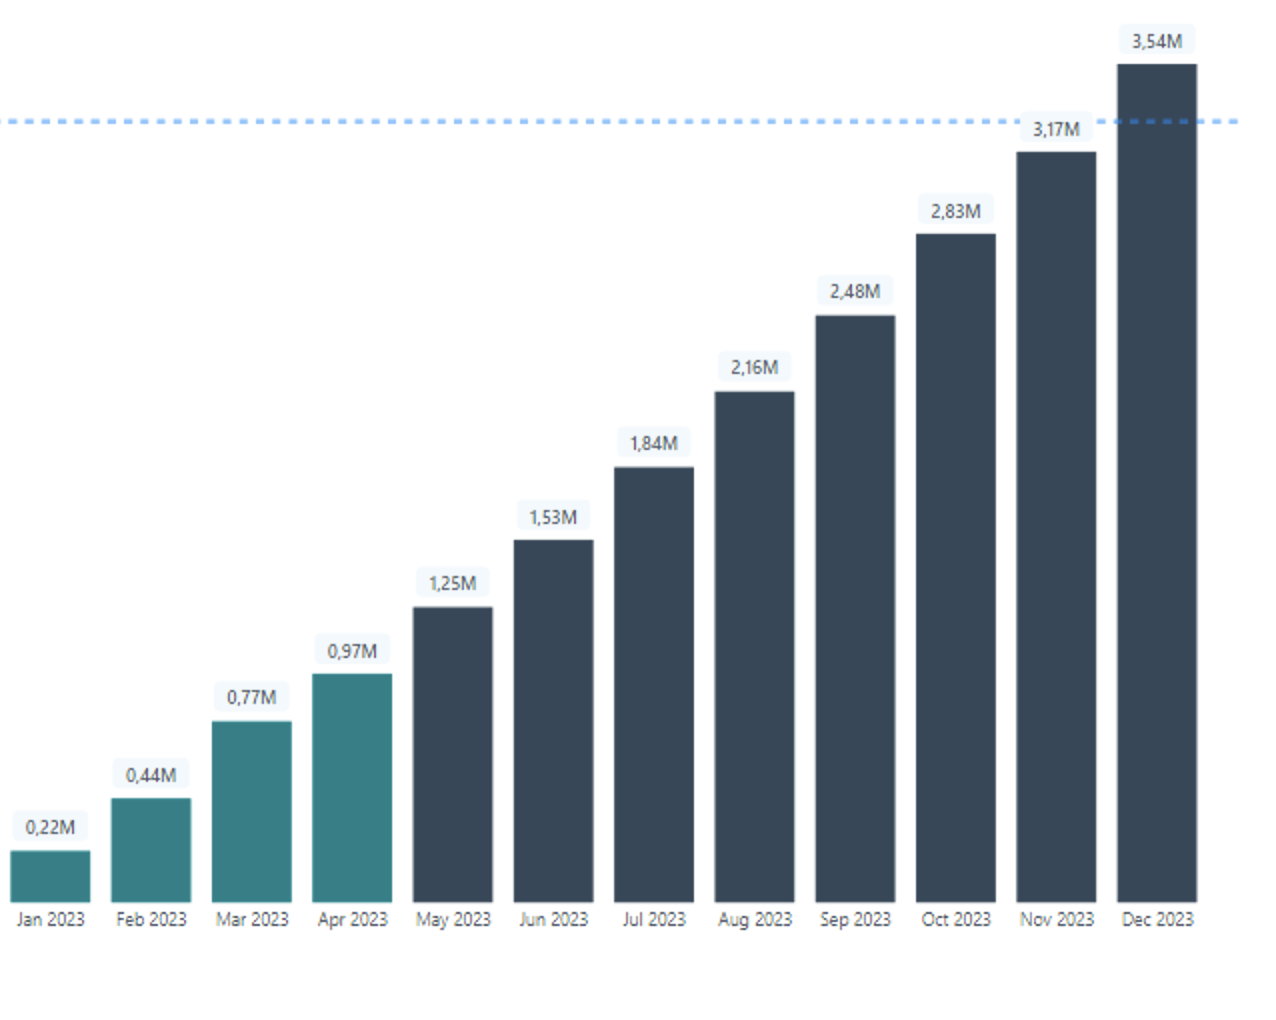
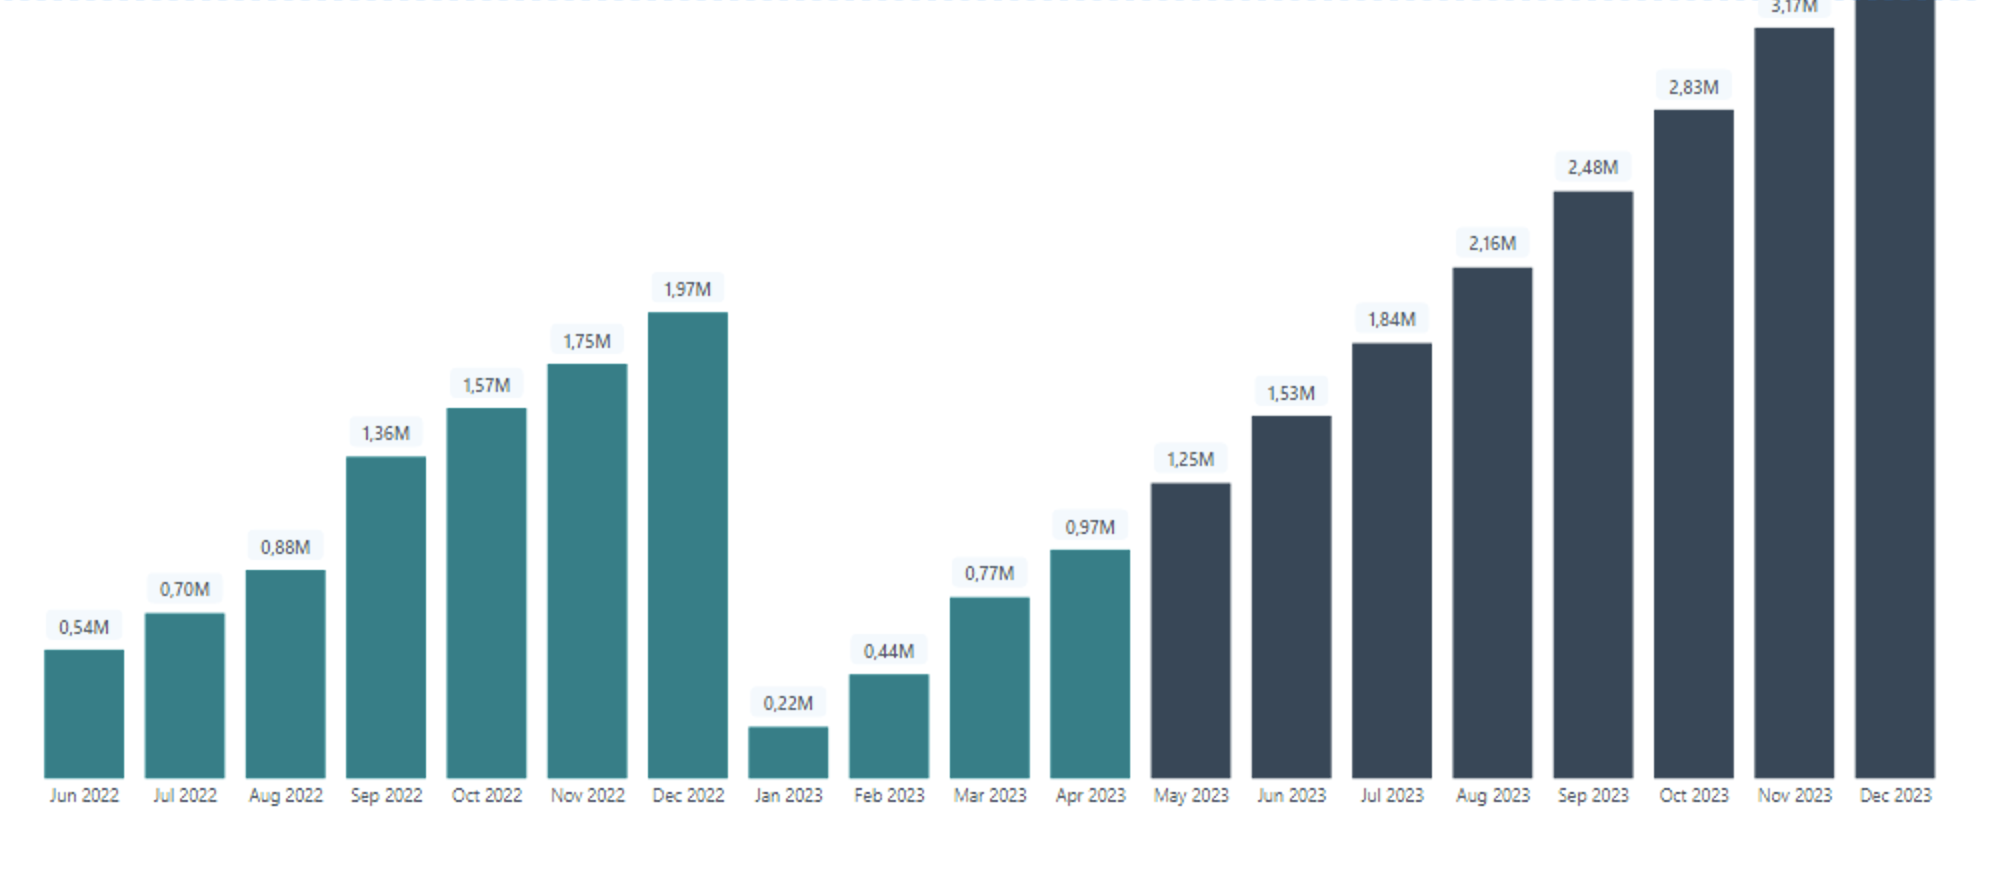
I am working on a report where I have to show actuals and target in one chart. I successfully did this but it shows for monthyear in the dataset in the chart like in fig 1. when I put a filter to show the actual and target for the whole of the current year, it only shows from jan-mar like in fig 2. what I would like is something like in fig 3. can you help please. below is the dax code I used;
Actual and Projection =
VAR LastCostDay =
CALCULATE(
MAX(‘Usage Details’[Date]),
ALL()
)
VAR Actualconsumption = [New consumption YTD]
VAR Result =
IF(
MAX(DIM_Date[Date]) > LastCostDay,
[New Projections YTD],
Actualconsumption
)
RETURN
Result
Thanks in advance for your help