Show label on the Comparison Chart

Hi ,
I tried to modify the existing deneb visual in Vega-lite. I wanted to show data labels on the trail however the labels is overlapping . I would like to see them aligned to the respective year.
In the mark block of the text , was unable to split the label based on the year. Could you please help?

Below is the modified code:

{
“$schema”: “https://vega.github.io/schema/vega-lite/v5.json”,
“data”: {“url”: “data/barley.json”},

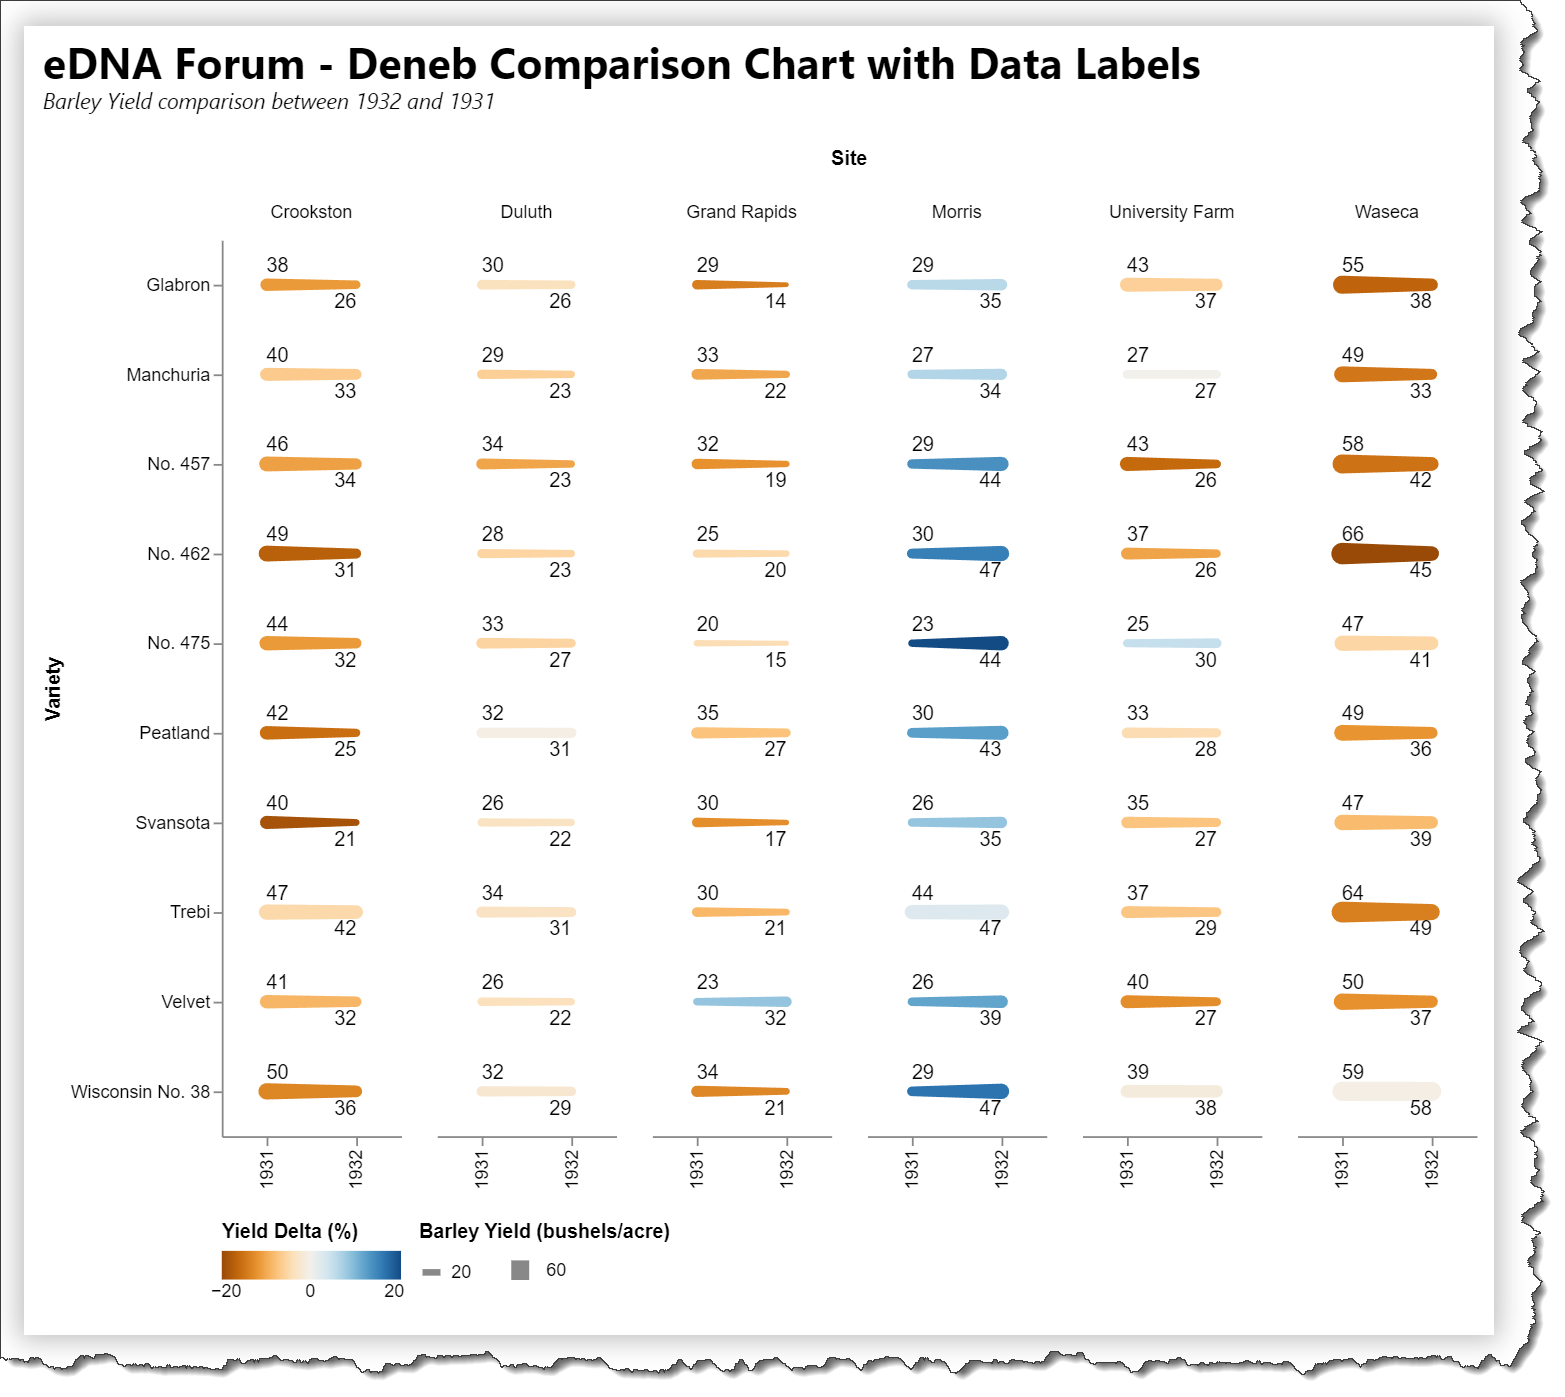
“title”: “Barley Yield comparison between 1932 and 1931”,
“transform”: [
{“pivot”: “year”, “value”: “yield”, “groupby”: [“variety”, “site”]},
{“fold”: [“1931”, “1932”], “as”: [“year”, “yield”]},
{“calculate”: “toNumber(datum.year)”, “as”: “year”},
{“calculate”: “datum[‘1932’] - datum[‘1931’]”, “as”: “delta”}
],
“facet”:{“column”: {“field”: “site”, “title”: “Site”}},
“spec”:{
“width”: 100,
“height”:500,
“layer”:[
{
“mark”: “trail”,
“encoding”: {
“x”: {“field”: “year”, “title”: null},
“y”: {“field”: “variety”, “title”: “Variety”},
“size”: {
“field”: “yield”,
“type”: “quantitative”,
“scale”: {“range”: [0, 12]},
“legend”: {“values”: [20, 60]},
“title”: “Barley Yield (bushels/acre)”
},
“tooltip”: [{“field”: “year”, “type”: “quantitative”}, {“field”: “yield”}],
“color”: {
“field”: “delta”,
“type”: “quantitative”,
“scale”: {“domainMid”: 0},
“title”: “Yield Delta (%)”
}
}
},
{
“mark”: {“type”:“text”,“align”:“left”,“dx”:-30},
“encoding”: {
“text”: {“field”: “yield”, “type”: “quantitative”,“format”:“.0f”},
“y”: {“field”: “variety”}
}
}],

“view”: {“stroke”: null}
},
“config”: {“legend”: {“orient”: “bottom”, “direction”: “horizontal”}}
}

Hi @dahlia.carroll:

Please upload a PBIX for future posts … the preparation of a Power BI foundation to visualize and evaluate your code took much longer than reviewing and commenting on your issue.

Regardless, the easiest way to prevent data label overlap is to use 2 separate text marks (one filtered for 1931 and one filtered for 1932) and add an “x” encoding to each. Here’s my solution, with a “yOffset” added to each text mark for illustration only:

Here’s the code:

{
  "title": {
    "anchor": "start",
    "align": "left",
    "orient": "top",
    "offset": 20,
    "text": "eDNA Forum - Deneb Comparison Chart with Data Labels",
    "font": "Segoe UI",
    "fontSize": 24,
    "fontWeight": "bold",
    "fontStyle": "normal",
    "subtitle": "Barley Yield comparison between 1932 and 1931",
    "subtitleFont": "Segoe UI",
    "subtitleFontSize": 12,
    "subtitleFontWeight": "normal",
    "subtitleFontStyle": "italic"
  },
  "data": {"name": "dataset"},
  "transform": [
    {
      "pivot": "year",
      "value": "yield",
      "groupby": ["variety", "site"]
    },
    {
      "fold": ["1931", "1932"],
      "as": ["year", "yield"]
    },
    {
      "calculate": "toNumber(datum.year)",
      "as": "year"
    },
    {
      "calculate": "datum['1932'] - datum['1931']",
      "as": "delta"
    }
  ],
  "facet": {
    "column": {
      "field": "site",
      "title": "Site"
    }
  },
  "spec": {
    "width": 100,
    "height": 500,
    "layer": [
      {
        "name": "TRAIL_MARK",
        "mark": "trail",
        "encoding": {
          "x": {
            "field": "year",
            "type": "ordinal",
            "title": null
          },
          "y": {
            "field": "variety",
            "type": "nominal",
            "title": "Variety"
          },
          "size": {
            "field": "yield",
            "type": "quantitative",
            "scale": {"range": [0, 12]},
            "legend": {
              "values": [20, 60]
            },
            "title": "Barley Yield (bushels/acre)"
          },
          "color": {
            "field": "delta",
            "type": "quantitative",
            "scale": {"domainMid": 0},
            "title": "Yield Delta (%)"
          }
        }
      },
      {
        "name": "TEXT_MARK_1931",
        "transform": [
          {
            "filter": "datum['year'] == 1931"
          }
        ],
        "mark": {
          "type": "text",
          "align": "left",
          "yOffset": -10
        },
        "encoding": {
          "text": {
            "field": "yield",
            "type": "quantitative",
            "format": ".0f"
          },
          "x": {
            "field": "year",
            "type": "nominal"
          },
          "y": {
            "field": "variety",
            "type": "nominal"
          }
        }
      },
      {
        "name": "TEXT_MARK_1932",
        "transform": [
          {
            "filter": "datum['year'] == 1932"
          }
        ],
        "mark": {
          "type": "text",
          "align": "right",
          "yOffset": 10
        },
        "encoding": {
          "text": {
            "field": "yield",
            "type": "quantitative",
            "format": ".0f"
          },
          "x": {
            "field": "year",
            "type": "ordinal"
          },
          "y": {
            "field": "variety",
            "type": "nominal"
          }
        }
      }
    ]
  }
}

Hope it helps.
Greg
eDNA Forum - Deneb Comparison Chart with Data Labels.pbix (1.5 MB)

Thank you @Greg Will make note of it.
And thank you for the solution. appreciate it.