I have a some basic HR analytics with the standard Starting Headcount + Hires - Termination = Ending Headcount measures and other derivatives of those.
I have reviewed your Sales and Orders in progress video, as well as some other posts regarding headcount, but my situation is slightly different.
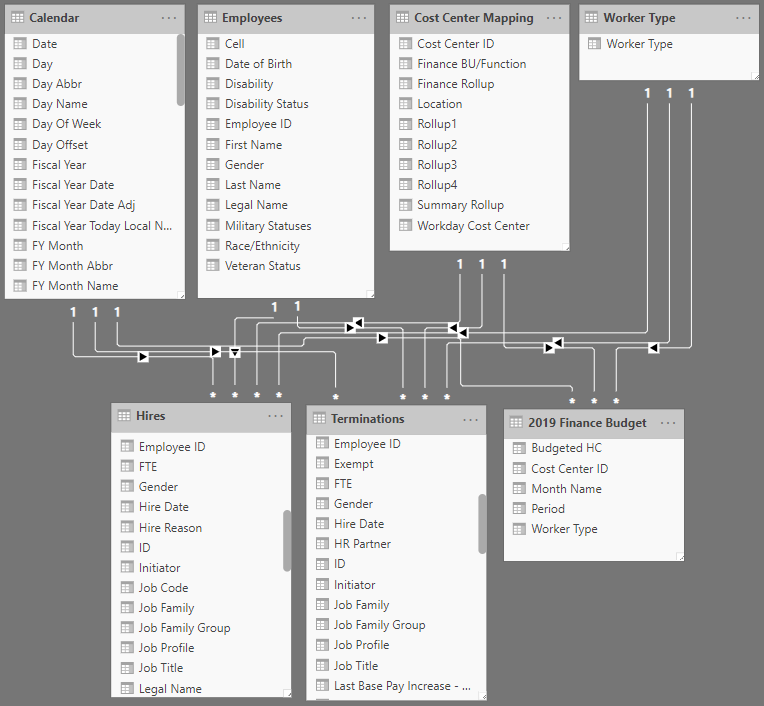
Instead of just one fact table that contains both the Start Date and the End Date for each employee, there are two:
Hires table with its respective attributes (e.g., Employee ID, Position ID, Start Date) as well as a
Terminations table with its respective attributes (e.g., Employee ID, Position ID, End Date).
Since that’s all the data that is needed to create the above mentioned measures, there is no need to create another summary table by joining Hires and Terminations tables. However, it would probably require a slightly modified DAX that the one you are using with your inactive relationships technique for both dates in the video.
The Hires and Terminations measures themselves are not difficult since each of them respectively only involves one table.
My question is - how can I modify the Starting Headcount measure from the one using just one table to the one using two different tables?
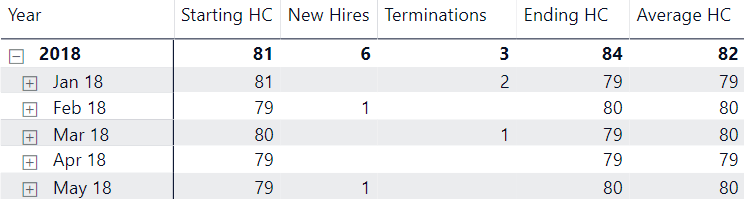
Here’s the current Headcount measures I am using from a single table called Job History (with two inactive relationships Start Date and End Date to ‘Calendar’[Date]). They are working correctly:
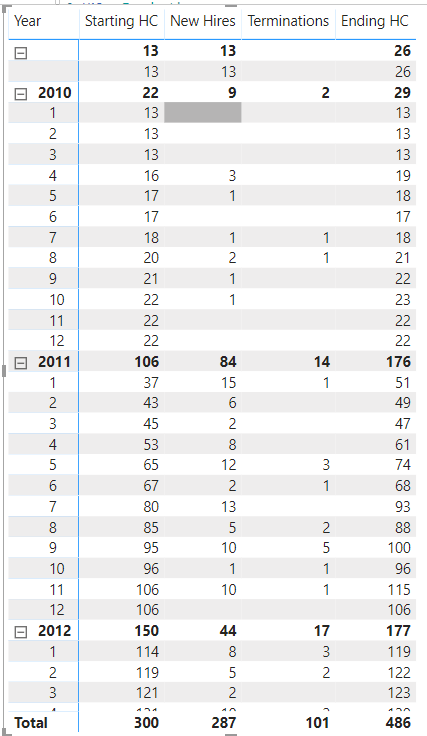
@Nick_M - sure thing! It would be too hard to randomize the one that I am currently using (and I can’t upload it for privacy reasons), but as an example, I grabbed a public dataset from Kaggle.
What I am trying to get to is something like this:
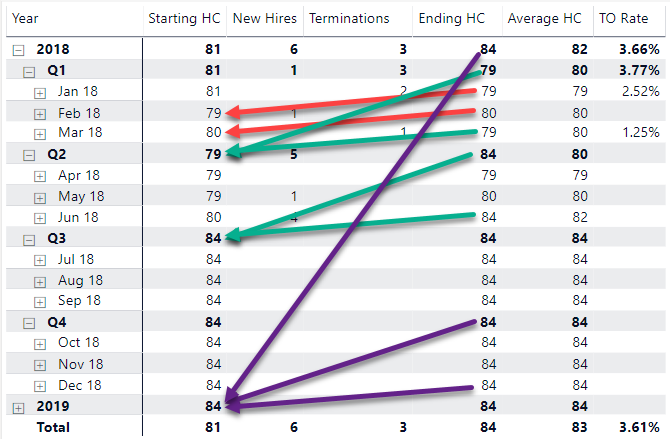
Ending HC = [Starting HC] + [New Hires] - [Terminations]
The cool thing with these measures is that since they are using CALCULATETABLE, you can do more than just countrows. You could use them as filters for CALCULATE, so you could do something like Sales of New Employees or anything else.
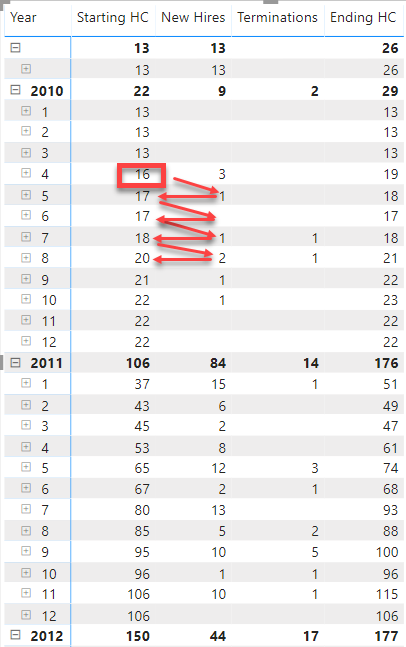
Hi @Nick_M! Thank you for taking a look! I think it’s a good start and something we can definitely build on! What I didn’t show you is that in my original example the numbers actually tie out between various different levels of date hierarchy. To illustrate, the Ending HC for 2018 is the Starting HC for 2019. If you follow the color coding on the arrows, you will see what I mean:
Going back to the way the measures in the new dataset are calculating, it seems like Starting HC is picking up the new hires for the same period, since it’s picking up all the hire dates <= MAX date of the filter context:
with MIN Start Date < MIN date of the filter context
AND
with MAX End Date >= MIN date of the filter context OR with End Date = BLANK
The issue is that all the Start Dates are in Hires table and all the End Dates are in the Terminations table and I just can’t get the Starting HC and Ending HC measures to work across two tables. They work fine when both sets of dates are in one table (using Sam’s inactive relationships technique mentioned in Sales and Orders in progress), but obviously need tweaking to get to work across two tables.
BTW, Ending HC is also an independently calculated measure with the following logic in English:
Count the number of employees:
with MIN Start Date <= MAX date of the filter context
AND
with MAX End Date > MAX date of the filter context OR with End Date = BLANK
@sam.mckay - would be interesting to hear your perspective on this. From the modeling perspective - is it better to join the two tables in this use case and use the formulas that work or can we (and should we?) get away with just having the Hires and the Terminations tables and use some other technique to create the measures, just with a different syntax?
@kirillperian@Nick_M
I would suggest this is really similar to how a general ledger for balance sheet accounts work where you need an opening periodical balance(which is cumulative) for each month and then show the movements (ie periodical new hires and terminations) which added together produce the closing balance(ending HC).
The problem I found when designing this kind of model is that when you are slicing the year and month this complicates the measures required. You need an opening balance for the year then an opening balance for the month and so forth. You probably then need to switch out the opening formula depending on what level you are reporting at month or year and use the Date Add formula to move the balances for the year or month required.
Have you examined the DAX formulas for opening balances at all?
@GarryA & @kirillperian There’s definitely a way to do this, I’m thinking using some form of LASTNONBLANK, SUMX and maybe scope and opening balances. This is not a easy answer for sure as there are quite a few nuances that must me taken into consideration. This will take some time to troubleshoot for sure.
I don’t see an issue with the two things tables here theoretically, but if it’s easy to append them or merge I would probably do that. Whatever makes things simpler is the option I would always go for.
If you can simplify the look of your model with less tables and if you can maintain the simplicity of the formula patterns then that is what I would aim for.
This is how I always approach things on the modelling and query editor side. Every time you simplify things here the simpler everything post that will be. Thats always been my experience.
Thanks, @sam.mckay! The issue here is that these are two mutually exclusive concepts. The formulas already exist (and work) for the merged table, but we do need the two other tables (Hires and Terminations) for their own analytics. So you see, simplification of the model leads to move complexity in the measures and vice versa - that’s really the dilemma. Reponding to @GarryA and @Nick_M though - drawing the parallels on opening balances: the original Starting HC formula (and all the other ones) work fine at any level, but when both dates are in the same (Job History) table that is a merge between Hires and Terminations. I listed it earlier, but here it is again: