Hello Everyone,
I’m reaching out to seek guidance or suggestions on an issue I’m facing with comparing Power BI reports, particularly in terms of UI changes.
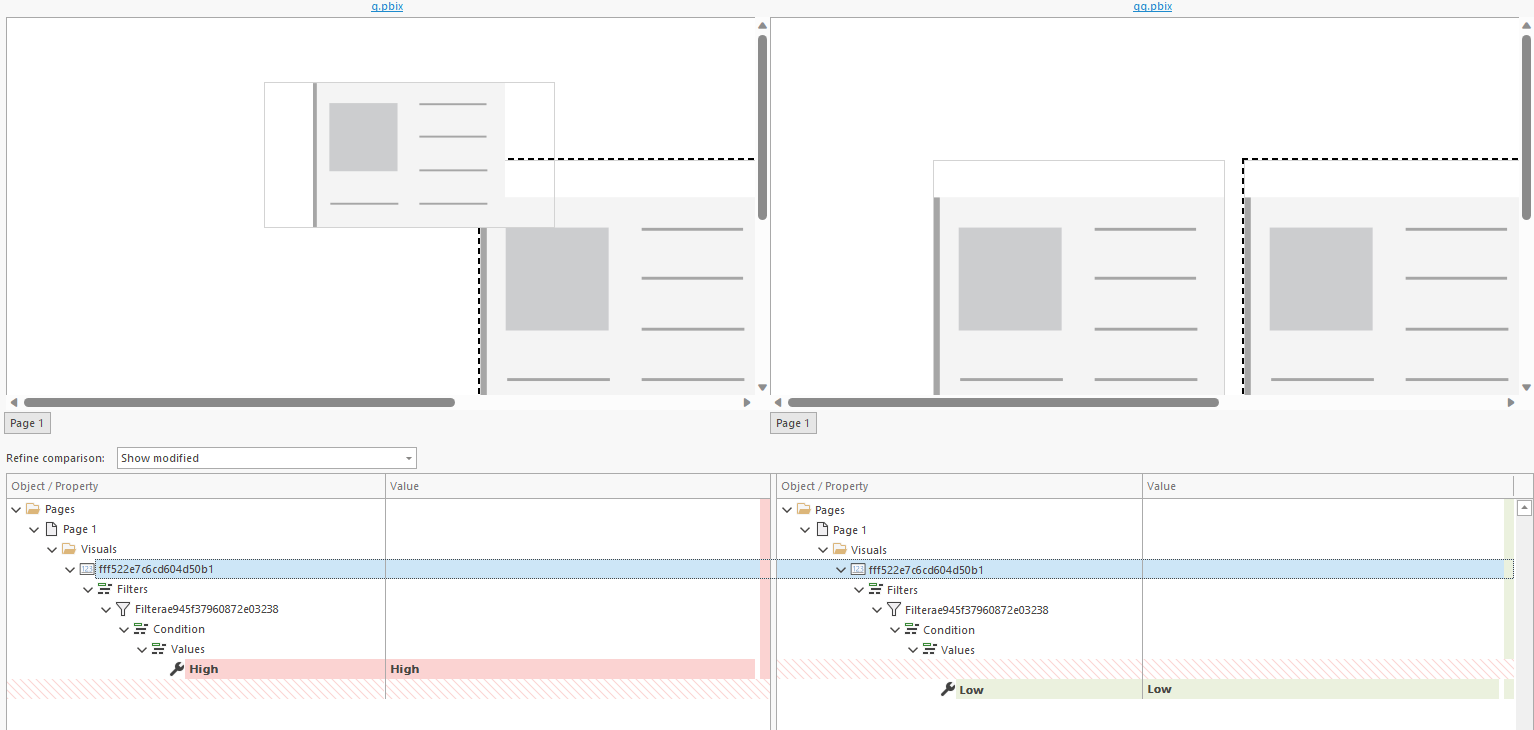
I am well-versed with tools like ALM Toolkit, and PBI Explorer, and I routinely use GitHub for version control, tracking differences with VS Code, and saving Power BI reports in the pbip project format. However, I’ve encountered a limitation with these tools as they do not facilitate the comparison of differences in the User Interface, especially in the filter pane at both the visual and page levels.
A significant portion of the logic in my reports is embedded in the UI’s filter pane, and this is where I need the most help. While I have experimented with Power BI Helper, it seems to be outdated and I’ve faced challenges in making it work effectively. Using VS Code allows me to spot differences, but given its detailed nature, identifying specific changes, especially in filters, becomes a formidable challenge.
Is anyone aware of a more efficient method or tool that can help compare, for instance, what filters have been changed between two different versions of a Power BI report? I am particularly interested in a solution that can provide a clearer view of changes made in the UI elements of the reports.
Any suggestions or advice on how to tackle this issue would be greatly appreciated.
Thank you in advance for your time and support.
Best regards,
Roberto
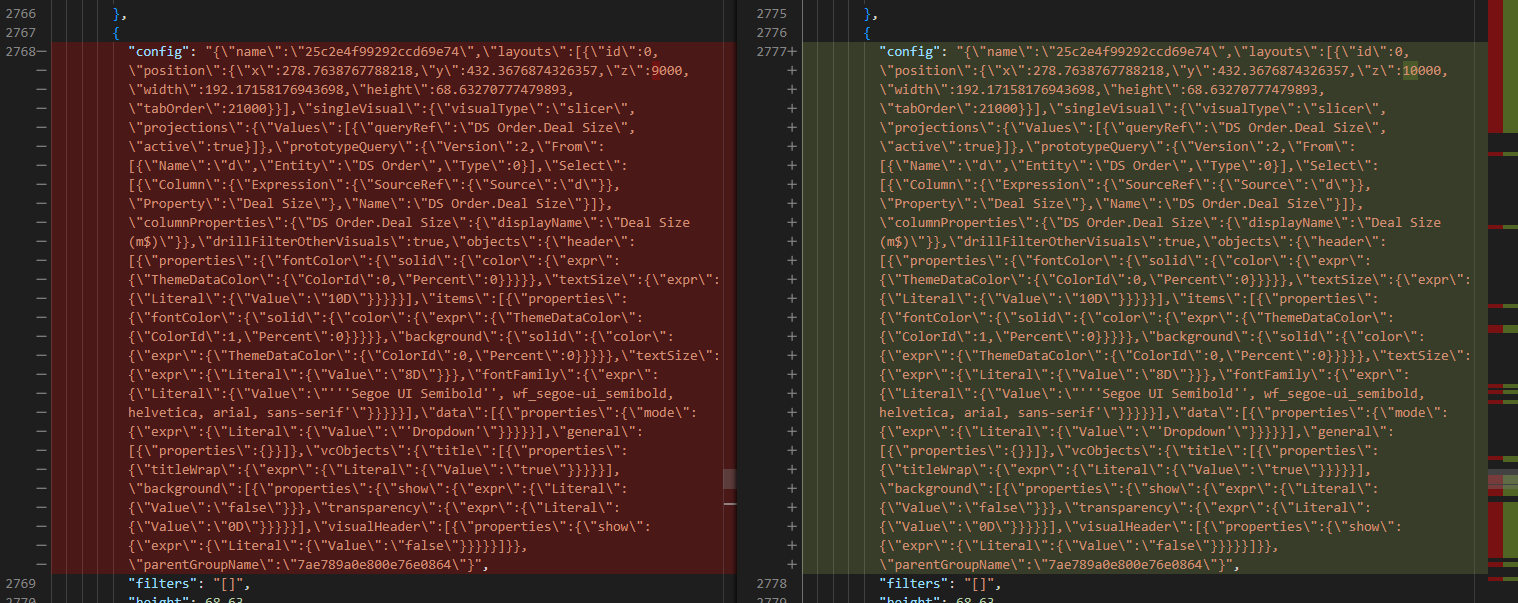
Here is one of the many differences found using VS Code. In this case, only the position of a visual has been changed.