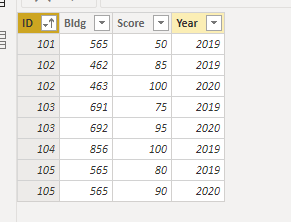
I have a table that has IDs, the building they are in for that year, & their score. I am trying to count IDs that have improved their scores over the year.
I have used the following measurement.
test =
CALCULATE(
COUNT(‘Table’[ID]),
FILTER(
ALL(‘Table’),
‘Table’[Year] = MAX(‘Table’[Year]) -1
)
)
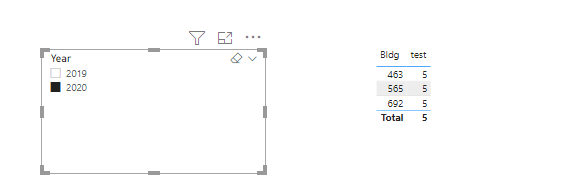
However, my outcome is not coming out as expected.
Please let me know if there is something I might be doing incorrectly here. I am attaching the file below. Score_Improvement.pbix (25.0 KB)
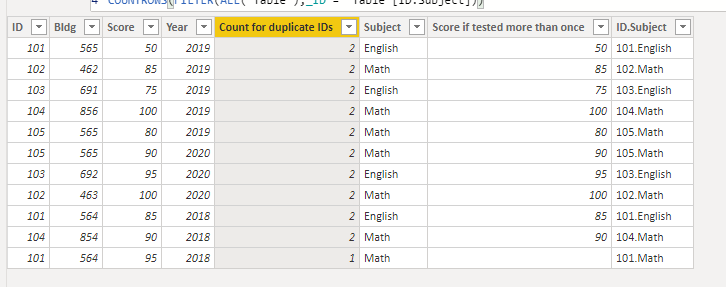
I have been able to get the scores for IDs that have taken it for more than one year. However, I am a little lost when it comes to calculating if they have improved.
I did modify the file a little bit more to make the sample more understandable.
Hi @supergallagher25. Your issue appears to have expanded since your first post, and your issue remains unclear. In your first post, you were asking about what building “they” (I’m guessing a student, or ID) were in, and your second post appears to disregard building and instead use subject. Can you please create an Excel worksheet with two spreadsheets, one with the source data, and one with a mockup of your desired outcome for the forum members to pursue further?
Greg
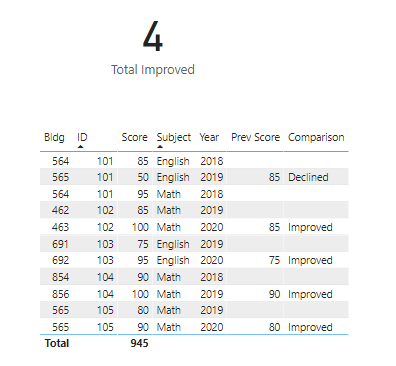
Thank you for responding. I apologize for the misunderstanding, I do still have the same issue. I was trying to add a few columns to see if there is another way around. I am trying to get a count of IDs who have improved their over the course of the years.
One other thing I meant to mention - if you want to do conditional formatting of the background, font or add icons to accent the results of the Comparison measure, you can just copy that code to a new measure, and in place of Improved, Declined and Stable substitute hex codes, color names or paste symbols from the emoji keyboard (win key and period) and the use that measure in the conditional formatting by field value.