Hi mbraun,
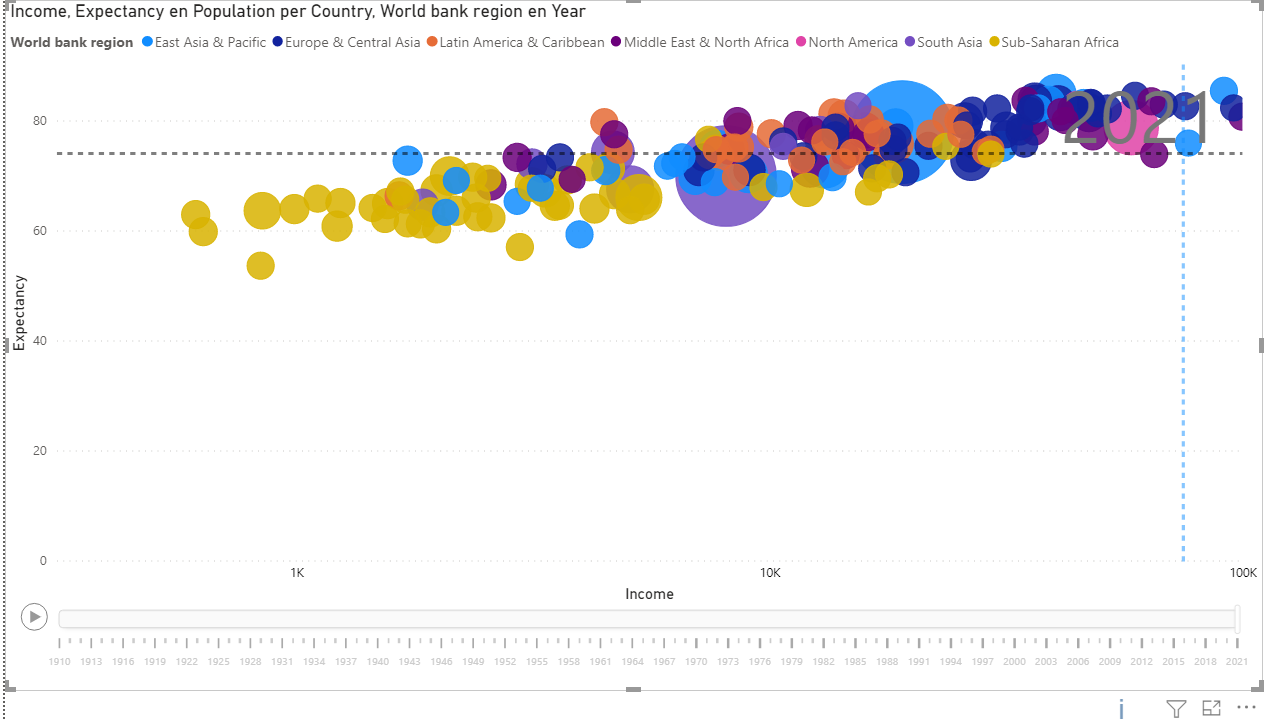
You could change your x-axis from linear to logarithmic (under x-axis). Combine that with an end of 100 000 and you have a graph which might be similar to what you are looking for: