Discovery.pbix (54.3 KB)
Session_Data_SAMPLE A.csv (1.7 KB)
Hello,
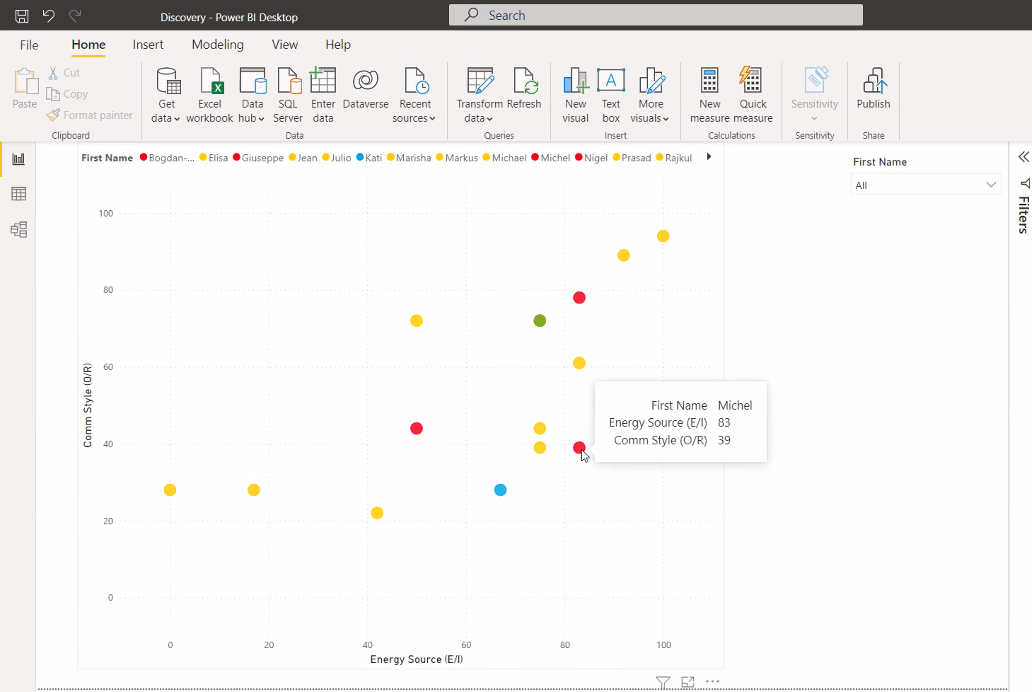
My team and I are currently building a mock-up for a client and have run into an visualization issue with our scatter plot. Our client wants the values in the legend to display next to their corresponding data points.
We are investigating if there’s a way to keep the tooltip open at all times, or if there is another way to visualize this.
Please see the attached screenshot for an example of what we are envisioning.
Best,
Pete
1 Like
Hi @pete.langlois I don’t think there is a way to get the tooltips to all remain open.
I’m sure this could be created in Carticulator or Deneb, the only issue would be tooltips overlapping and becoming unreadable.
DJ
Hi @pete.langlois, we noticed that no response was received from you with regard to the post above.
We just want to check if you still need further help with this post.
In case there won’t be any activity on it in the next few days, we’ll be tagging this post as Solved.
Hi @pete.langlois, due to inactivity, a response on this post has been tagged as “Solution”. If you have a follow question or concern related to this topic, please remove the Solution tag first by clicking the three dots beside Reply and then untick the check box.