Hi there,
Having some trouble doing something that would seem quite simple (and I wouldn’t be surprised if the solution is fairly simple as well), but hoping I could get some help here.
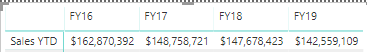
I’m trying to show a matrix that has Sales YTD in the row, and Fiscal Years in the column.
The Sales YTD measure is as follows:
Sales YTD = CALCULATE([Sales YTD],DATESYTD('4a - Calendar Table'[Date],"31/3"))
A few notes:
- My fiscal year runs from April 1 - March 31.
- Assume the current date is January 27, 2019.
- I’m using the calendar code from Enterprise DNA training
The FY19 column shows up fine, as the dollars represent sales from April 1, 2018 - January 27, 2019. But for all prior fiscal years (e.g. FY 18), it’s showing total dollars for the entire fiscal year from April 1 - March 31, rather than from the period of April 1 - January 27 in each respective fiscal year so it’s no longer an apples to apples comparison.
How do I fix it so that each fiscal year column shows the same period (e.g. April 1 - January 27)?
(my original workaround was to create a YTD measure for each fiscal year, but it’s harder to keep clean formatting)
Thanks in advance for your help!
Kevin