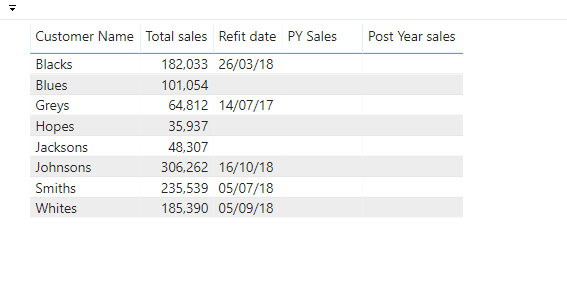
Hi- still learning my way around Power Bi. I have two fact tables, one that holds all sales data and the other that has a specific list of our retail outlets that has a date of when the shops last had a refit. I want to create a visual table that shows the shop name, date of refit, which can obviously come straight from the second table, then with two further columns that show the previous years sales and the 12 month sales after the refit.
When I use the dateadd function based the date column in refit table I get an error saying that the dates aren’t contiguous. If i use a date table it just gives my the data based on a slicer rather than picking up the date of the refit. I have about 40 stores to look at so really need to show in one visual for the end users!
From your description, it sounds like this is primarily a data modeling problem. I don’t think your Shop table is a fact table, but instead a dimension table with a slow changing dimension (date of last refit). Also want to look at how you have your date table set up and marked. I don’t think this is going to be difficult to fix, but if you could please post your PBIX with fictitious data/names substituted for anything sensitive, that would be a huge help in getting this resolved.
@sam.mckay requires that all business on the forum be conducted publicly, so that others can learn from the issue as well. Thus, if you can post a non-sensitive version of your PBIX, that would be ideal. If you need them, here are instructions on how to post your PBIX:
OK, as suspected, it’s your data model that’s giving you a world of problems here. Even if your DAX is flawless, it will never give you the correct results with the data model structured as is. Here are the problems that need to be corrected (mixed in with some best practices that will just make things a lot easier…):
rename different Name fields to something more descriptive, e.g., Customer Name, Store Name, etc. Very confusing to have multiple fields called Name that refer to completely different things. Renaming them will make DAX debugging and visualization creation much easier.
rework data model – Refit is not a fact table. It is a dimension/lookup table with a slow changing dimension (refit date). Don’t worry about the slow changing dimension (SCD) aspect for the moment - let’s get the general data model correct first, but at some point you will need to make a decision about how to handle the SCD. (You can find a discussion of the relevant strategies here on the forum)
rename Refit table to Stores - refit date is just an attribute of Stores
restructure Customer table – should include both Customer ID and Customer Name fields
the relationship you have between your Customer table and your Refit table is very problematic for two reasons: a) there should be no direct relationships between lookup tables; b) the relationship you currently have is between Customer Name and Refit Date, which have no logical relationship to each other and are of different data types
your lookup/dimension table relationships are made via the name fields, rather than unique ID fields. This is a problematic because you may have, say two different customers named Smith, which will result in a many-to-many relationship between your Customer table and your Sales table (to be avoided if at all possible, since it will substantially complicate your data model and DAX, and is easily avoidable in this case)
your Store table should contain a unique Store ID field for the reasons discussed above in 6)
your Sales table needs to have a field for Store ID (or at least Store Name, though that is far less optimal than unique ID number for the reasons discussed above). Without a way to create a direct relationship between those two tables, you won’t be able to accomplish the analysis you want to perform.
With this schema, and a properly marked date table, it should now be a relatively straightforward task to accomplish your targeted analysis using the DATEADD function:
I would also recommend taking another look at the data modeling sections of this course:
I hope this is helpful. If you have any additional issues or questions after reworking your data model, just give a shout.
Brian,
Thanks for taking the time to help. Its all very useful as I am still getting to grips with Power Bi!
I have done the changes and had a look over the videos but cant quite find a scenario like the one I am trying to solve.
Because of the number of stores I am looking at it would take to long to use a slicer as they all have specific dates. Ideally I need a table like the one above that presents the year before sales and the year after picking up the refit date.
I’ve tried a few dax measures but not getting anything that helps- any advice on the actual formuales?
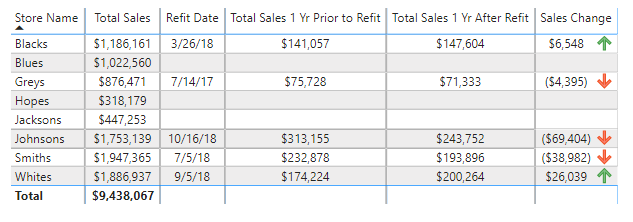
As is almost always the case with Power BI, there are a number of different ways to do this. However, for this situation I like the DATESBETWEEN( ) function since it gives you easy control over the start and end dates of your calculation range. Here’s the measure I used for the post-refit calculation:
The pre-refit measure is almost identical, but with the date range obviously moving in the opposite direction. You may need to fiddle with these a little, depending on whether you want either measure to be specifically inclusive of the refit date (I started one day after, and one day before).
Hope this is helpful. Full solution file posted below.
Thanks – glad to help. Give a shout if you have any other problems, but now that your data model is in good shape, hopefully it will be a smooth ride from here.
Enjoyed working with you on this. Good luck on the project.
Thanks Brian,
It was a request from one of our sales managers and is part of a much bigger project the business is involved with.
We are building a data warehouse and then moving all of our financial reporting over to Power Bi. I have used excel all my life so it has been a massive learning curve.
I have found the enterprise DNA teaching extremely useful it getting me started but I have a lot to learn!!
Regards
Rob