We use saleforce for our sales team to enter prospects into a sales pipeline with various sales stages. Each stage has a probability of closing, close date, and projected monthly sales volume.
What I am trying to do is analyze the sales pipeline to project sales over the next 12 to 24 months.
In our industry there is an adoption period after a customer joins, which means that it takes time for sales to ramp up.
What I want to build is a view using the pipeline in salesforce and project monthly sales volume based on the projected monthly volume, discounting the volume based on the sales stage probability and then applying a monthly ramp discount over 6 months.
All my research has lead me to believe this is not possible to do in Power BI.
There’s nothing in your description above that makes me think this isn’t doable in Power BI. However in order for us to provide you a specific solution, we’ll need two things:
a sample dataset to work from
a mockup of the results/outcome you’d like to see - you can provide this using Excel, PowerPoint or even a hand-drawn sketch
If you data has any confidential information in it, here’s a short video on simple techniques that can be used to anonymize/mask it in order that you can post it on the forum:
Super – thanks for the quick response, that’s exactly what I needed.
I absolutely guarantee this is doable in Power BI. This is the type of problem that power BI was designed to handle. The relative timing of the discounts is an interesting wrinkle, but I’ve already got a general solution forming based on the use of the offset function in the Extended Date Table.
Let me take a run at this tonight after work, and hopefully will have a solution back to you sometime tonight.
The relative timing of the discounts is the tricky part. In excel, I used the datedif function to return a number then indexed that number to the month number of the ramp discount.
My issue with excel is that the spreadsheet became way to difficult to maintain.
I used the datedif function to return a number then indexed that number to the month number of the ramp discount.
This is basically what we’re going to do with the date offsets in an automated way.
My issue with excel is that the spreadsheet became way to difficult to maintain.
I hear you. I did this type of stuff in Excel for nearly 30 years. Now, literally the only thing I use Excel for is: a) as an easy way to pull data into Power BI; b) to play around with mockups of what I want my Power BI reports to do.
The key here was to set the relationship between the date table and the fact table to inactive to keep the Go Live Date from filtering the future forecast dates in the matrix column.
Basically, I just created three key measures. The first calculates the elapsed number of months for each cell of the matrix, the second does a lookup of the monthly discount based on the results of the first measure, and then based on the results of the second measure I calculated the expected monthly discount sales. Here’s the DAX for each measure:
Months Elapsed =

VAR Unfilt =
CALCULATE(
    DATEDIFF(
        SELECTEDVALUE( Data[Go Live Date] ),
        SELECTEDVALUE(Dates[FirstDayofMonth] ),
        MONTH
    ),
   ALLEXCEPT(
        Dates,
        Dates[FirstDayofMonth]
   )
)

VAR Result =
IF(
    SELECTEDVALUE( Dates[FirstDayofMonth] ) < SELECTEDVALUE( Data[Go Live Date] ),
    BLANK(),
    Unfilt
)

RETURN
Result

  Monthly Discount Lookup =

VAR Discount =
SWITCH( TRUE(),
    [Months Elapsed] = 0,
        BLANK(),
    [Months Elapsed] < 7,
        LOOKUPVALUE(
            Discounts[Discount],
            Discounts[Offset Threshold],
            [Months Elapsed]
        ),
    LOOKUPVALUE(
        Discounts[Discount],
        Discounts[Offset Threshold],
        7
    )
)

RETURN
Discount

Discounted Monthly Sales =

VAR AllClientDiscount =
LOOKUPVALUE(
    Discounts[Discount],
    Discounts[Offset Threshold],
    0
)

VAR Result =
( [EV Monthly Sales] * AllClientDiscount ) * (1 - [Monthly Discount Lookup] )

RETURN
IF(
    SELECTEDVALUE( Dates[FirstDayofMonth] ) <= SELECTEDVALUE( Data[Go Live Date] ),
    BLANK(),
    Result
)
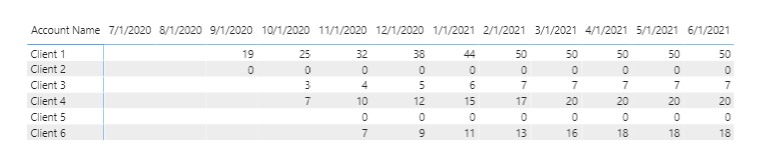
I hope this is helpful. It’s a pattern I haven’t quite seen before, so it was fun working through this one. Full solution file posted below.
Happy to help on this, but the way this works in the forum is once an initial problem is marked solved, it’s fine to ask follow-up questions if you need to understand the solution provided. However if you have a new requirement, we ask that you please start a new thread. This keeps new questions from getting lost amidst those already marked solved.
Also, when you do that if you could please provide a similar markup of the result you want to see for this new requirement, that would be extremely helpful. The one you provided for the question above was perfect, and really helped guide my solution development.