Hello all, I’m not sure why I can’t get this right - perhaps it’s my migraine…
During the recent quarantine situation, we had to change a lot of our customer’s deliveries over to a commercial delivery option. Now I have been asked to build a report that shows the sales that moved from a given group of truck routes over to the commercial delivery.
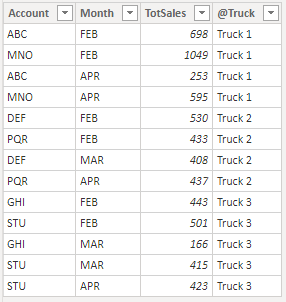
Example - if customer ABC was getting delivery from Truck 01 anywhere in the period of January - April (dates and trucks filtered by slicer on the page), then my sales for Truck 01 needs to be the total sales for customer ABC.
And, of course, I need this to be a total amount, not showing the customers because of the number of customers returned for each truck.
I have attached a simplified PBIX example. I keep thinking my answer here is CALCULATETABLE - but I just can’t get it to work. And (of course) most CALCULATETABLE examples are involving dates, not trucks Any help is welcome
I suppose the easy solution of just removing the truck doesn’t work? If not, is it just one internal truck that delivers to a route, or do you have multiple trucks?
If just one truck, you could potentially make another lookup table of companies to trucks
Then if you put a calculated column in the ‘Sales Data’ table. That would say something like
If (LEFT([Ship Code] , 1] = A, RELATED(get the related company truck from the new related company truck table).
Then just use the new calculated column for your report. If you have multiple trucks per company, I think this would almost be impossible.
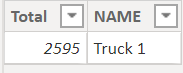
I don’t have a full solution for you yet, but I think I’ve got a partial credit answer. I worked this out as a physical table, and it’s returning the correct result. However, when I translate into a measure, the context gets all screwed up and it returns the wrong number. Here’s the DAX for the physical table for Truck #1:
Sales by Cust and Truck =
VAR SelectedTruck = "Truck 1"

VAR CustByTruck =
FILTER(
    ADDCOLUMNS(
        CROSSJOIN(
            ALL( Customer[Account] ),
            ALL( 'Ship Agent'[NAME] )
        ),
        "@TotSales", [Total Sales]
    ),
    'Ship Agent'[NAME] = SelectedTruck &&
    [@TotSales] > 0
)

VAR ToTSalesByTruckCust =
ADDCOLUMNS(
    SUMMARIZE(
        CustByTruck,
        [Account]
    ),
    "@CustTot", [Total Sales]
)

VAR Result =
ROW(
    "NAME", SelectedTruck,
    "Total",
    SUMX(
        ToTSalesByTruckCust,
        [@CustTot]
    )
)

RETURN
Result
I need to call it a night, but hopefully this get you pretty far down the field and you can figure out how to carry it over the goal line as a measure…
Wow – awesome work! I think if @Heather had the ability to add tables to her model, this would be a full solution.
@Heather - do you want to take the first crack at translating this to a measure? Based on my experience last night, I’m pretty sure that’s going to be a beast of a task, but I think with the three of us working together on it, it will be doable.
Thank you both! hopefully this will give me a direction to go in.
I’m back in the office for the first time since early March, so not sure how much will get done on it today - but yes, I’m going to see if I can tackle translation of this into a Measure, and I will post back here with my findings. At least we have a starting place!
Good luck being back in the office - we’re still on work from home orders.
Give a shout if you run into any problems. This is a really challenging one, and working with very complex virtual tables is a bit like doing surgery with the lights off. Do you use DAX Studio? If so, I find the techniques in this video really helpful for difficult virtual table work:
I have used Dax Studio some, but not much - so I will definitely take a look at that video. Thank you again Brian
Re: back in the office, I we have at least moved desks around and are not all back in the office at one time. (Tomorrow I’ll be back in my home office, then back here on Wednesday - it’s odd, to say the least)
Hi @Heather, a response on this post has been tagged as “Solution”. If you have a follow question or concern related to this topic, please remove the Solution tag first by clicking the three dots beside Reply and then untick the check box. Thanks!
Well, I have run out of time to find an actual solution, and I"m going to have to go with a less efficient solution, pulling the accounts that were delivered via the specific trucks, and then pulling all sales for those accounts and matching them up with Excel formulas. Not an elegant solution, but at least it solves what management needs - and that’s the ultimate goal even if it’s not an easily repeatable solution.
Thank you to both @BrianJ and @Melissa, I have pulled copies of your examples and will continue to work from them to hopefully come up with an actual solution. If I do find an actual solution, I will post back to here.
So I realize you’re working of a connected dataset but would it be possible to create a disconnected summary table in that model and use Power Query M to translate the Shipper codes ??
Think that would resolve all issues… including the more difficult lineage/context transition.
@ Melissa, I’m looking into that now - not sure how feasible it will be since we have a LOT running off of that dataset.
What I might do instead (since I’ve seen the roadmap showing composite models allowing for a connected dataset to be extended with additional tables) is to copy the dataset I’m working from and build the disconnected summary onto the copy.
Then, once the composite models is released (September I think), I can point my report back to the standard model and simply add a table in the report that is handling route productivity.
Testing your solution and Brian’s now, to see which will be more efficient for the larger dataset.
Are you referring to the MBAS session by Christian Wade? Because I must say ever since I’ve seen that video I just can’t wait for it to be released… That is going to be mind blowing powerful.
Yes, that’s exactly the one I’m talking about - and I agree, it’s going to be a real game changer.
Considering that my main dataset is currently supporting sales data, profitability models, warehousing, and even some accounting - it’s gotten more than a bit unwieldy at times. I have started documenting the measures and tables that are going to be really needed in the ‘core’ model versus those that are really only to support one or two ancillary reports.
It’s going to take some time to clean everything up once the update arrives, but I’m really looking forward to it
 Any help is welcome