Running Total based on Dynamic Ranking

Hi,

I am putting together a dynamic receivables report where a user can look at bucketed receivables over past dates and see what the ageing report would have looked like. I have created a days overdue and a dynamic ranking based on the date selected by the user.

I have also created a running total measure that works seemingly perfectly as does the ranking. I am simply trying to select those numbers from the running total with a ranking of 1 and sum them so they can be aged by group.

I have attached a small pbix file with one customer as an example since the file is quite large.

There are two dates in the data. Document Date refers to the original dates of each transaction (EOM). Debit date refers to the first transaction associated with an invoice. Unfortunately, due to the amount of transactions, I have had to group all transactions to the ends of the month and lost the unique invoice numbers. Hence the Debit Date so I know when to net off the credit once a date has been selected that is after the credit was transacted. This way I know when to include a credit transaction (based off document date) and what month to net it off (based off debit date) assuming the credit to the invoice was not in the same month as the invoice. I am using the Document date to filter the ranking and using the debit date to net them off properly.

Both dates are connected to my date table with inactive relationships.

I assumed I would be able to easily grab the running total value with a ranking of 1 and calculate it into ageing groups but it is not working and I am stumped. See file below.

Any help is greatly appreciated and if you have any questions please let me know.

AR Report Test.pbix (435.3 KB)

Hello @Shane1,

Thank You for posting your query onto the Forum.

In order to achieve the results based on the scenario that you’ve mentioned. Below are the couple of DAX measures alongwith the screenshot of the final results provided for the reference -

RT AR per Group - Harsh = 
SUMX(
    CALCULATETABLE( 
        SUMMARIZE(
            'GL Total 2' , 
            'GL Total 2'[Unique Customer Code] , 
            'GL Total 2'[Document Date] , 
            'GL Total 2'[Debit Dates] ) ,
        FILTER( ALLSELECTED( 'GL Total 2'[Entity Code] ) , 
            [RT3 Date Rank] = 1 ) , 
        FILTER( 'GL Total 2' ,
            COUNTROWS(
                FILTER( 'Aged Debtor Groups' ,
                    [GL2 Days Overdue] >= 'Aged Debtor Groups'[Min] &&
                    [GL2 Days Overdue] <= 'Aged Debtor Groups'[Max] ) ) > 0 ) ) , 
    [RT3 AR per Group] )
RT AR per Group - Harsh - Totals = 
IF( ISINSCOPE( 'GL Total 2'[Unique Customer Code] ) , 
    [RT AR per Group - Harsh] , 
    SUMX(
        ADDCOLUMNS(
            SUMMARIZE(
                'GL Total 2' , 
                'GL Total 2'[Unique Customer Code] , 
                'GL Total 2'[Document Date] , 
                'GL Total 2'[Debit Dates] ) , 
            "@Totals" , 
            [RT AR per Group - Harsh] ) , 
        [@Totals] ) )

I’m also attaching the working of the PBIX and Excel file prepared for cross-verification of numbers for the reference purposes.

Hoping you find this useful and meets your requirements that you’ve been looking for.

Thanks and Warm Regards,
Harsh

AR Report Test - Harsh.pbix (437.2 KB)

AR Data Cross-Verify Where Ranking = 1 - Harsh.csv (11.5 KB)

1 Like

Hey Harsh,

Thank you so much for the quick reply. Unfortunately, that is not quite what I am looking for but I think I may have not explained the issue well enough.

When you open the PBIX file there should be a column in the output table called RT Test and next to it a column called RT3 Date Rank. The RT Test is a running total measure of the debits and credits from the data according to the debit dates within each unique debit reference category (basically customer concatenated with month and year of the transaction). This running total should be correct as well as the debit date rankings.

If you notice the RT3 date rank should have rank #1 with the latest date within each unique debit reference category. This basically represents the running total at the end of each month that a customer had transactions.

It is only those singular values from RT Test with RT3 date rank =1 that I want and then I want them summed and bucketed. Each value with RT3 Date Rank = 1 should represent the month ending running total for that customer.

In the above visuals the column with total 50,698.58 is the correct receivable for this customer when looking at it from 10/31/2022. The problem is the bucketed amounts are way off since we don’t have over -15M in receivable over 360 days.

The correct number when selecting Oct - 2022 in the slicer should be 50,968.58. There should be 4095 of receivable from the end of September and 46,603.58 from October. All other RT3 Date Rank = 1 should be 0.00 when you open the file because the invoices prior to September have been paid.

When you open the file you will see all date ranks of 1 when compared to the RT Test column are 0.00 except for september debit dates and october debit dates when the debit dates are sorted descending. September will have an amount of 4095 for date rank 1 and october will have an amount of 46,603.58. You will also see some amounts in those last 2 months that have blank ranks. That is because the document date is after the slicer selection of October 31, 2022.

The document date is there only to determine whether or not to include a transaction based on the slicer selection. The debit dates are there to know when to net off credits to invoices because I have had to group everything by month to reduce rows. For example, an invoice that was booked in June and paid off in October will have two different document dates but the debit dates will both be June. That way I know if the slicer selection is before October, the payment to invoice hasn’t happened therefore it is still a receivable. However, once October has been selected, the payment has occurred but I want to reflect that payment back in June against the invoice, hence the debit dates. This will not result in wildly positive and negative months.

I am just having the issue of selecting the values of each RT3 Date Rank = 1 (even though most will be 0.00) and summing them to be bucketed. This is where I keep having issues with getting the correct amounts from the running total. For some reason I cannot get a formula to only select the single value from RT Test where RT3 Date Rank = 1, sum them up, and then bucket them according to the due date.

This whole problem stems from having to group the rows by month. I can get the historical buckets no problem with the document number in the rows. The problem is that table is millions of rows and the simple act of bucketing receivables historically in a matrix visual takes minutes to update when new dates are selected in the slicer.

1 Like

Hello @Shane1,

The reason why the solution got more complexed is because neither you separated the columns with datetime data type into two different columns i.e., one column for date and other one for time nor you created a proper data model i.e., star schema.

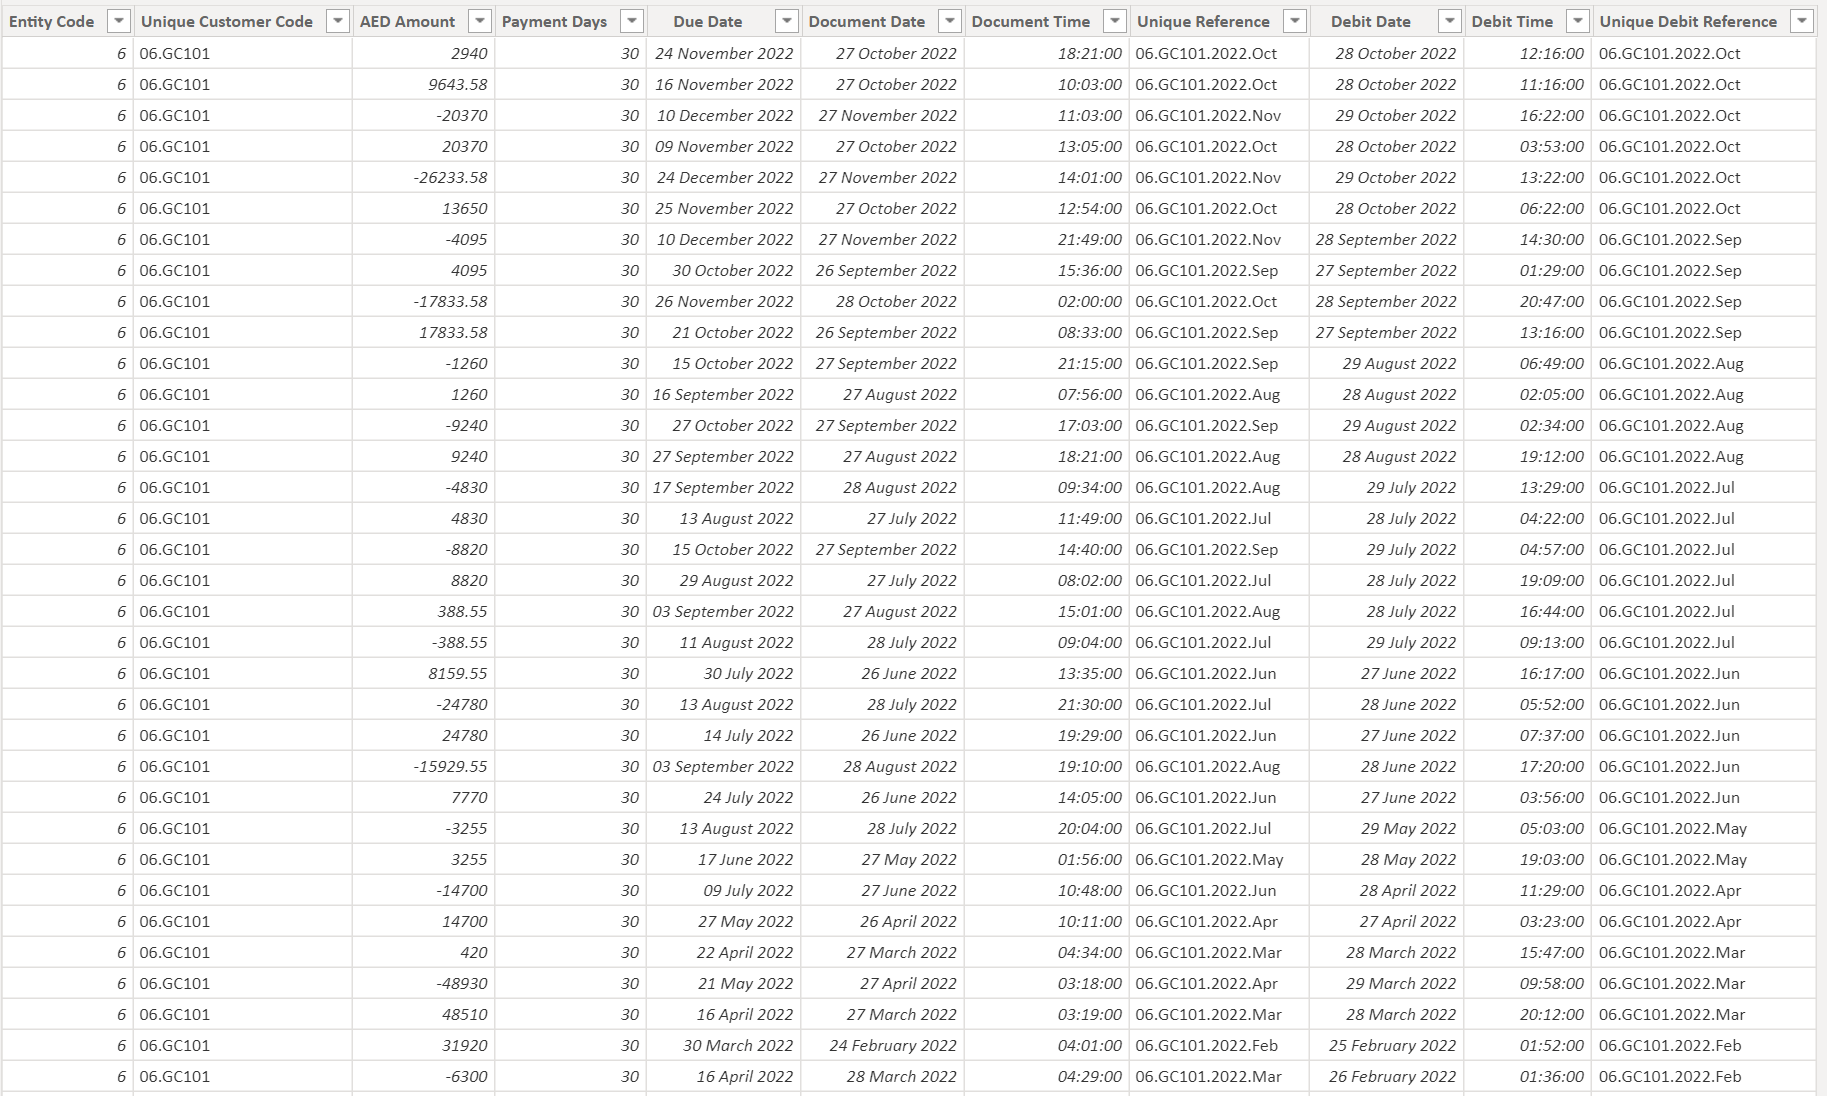
So the first thing that I did now is, to split the columns and parse them into two separate columns and then convert the flat file into a star schema. Below are the screenshots of the data model provided for the reference -

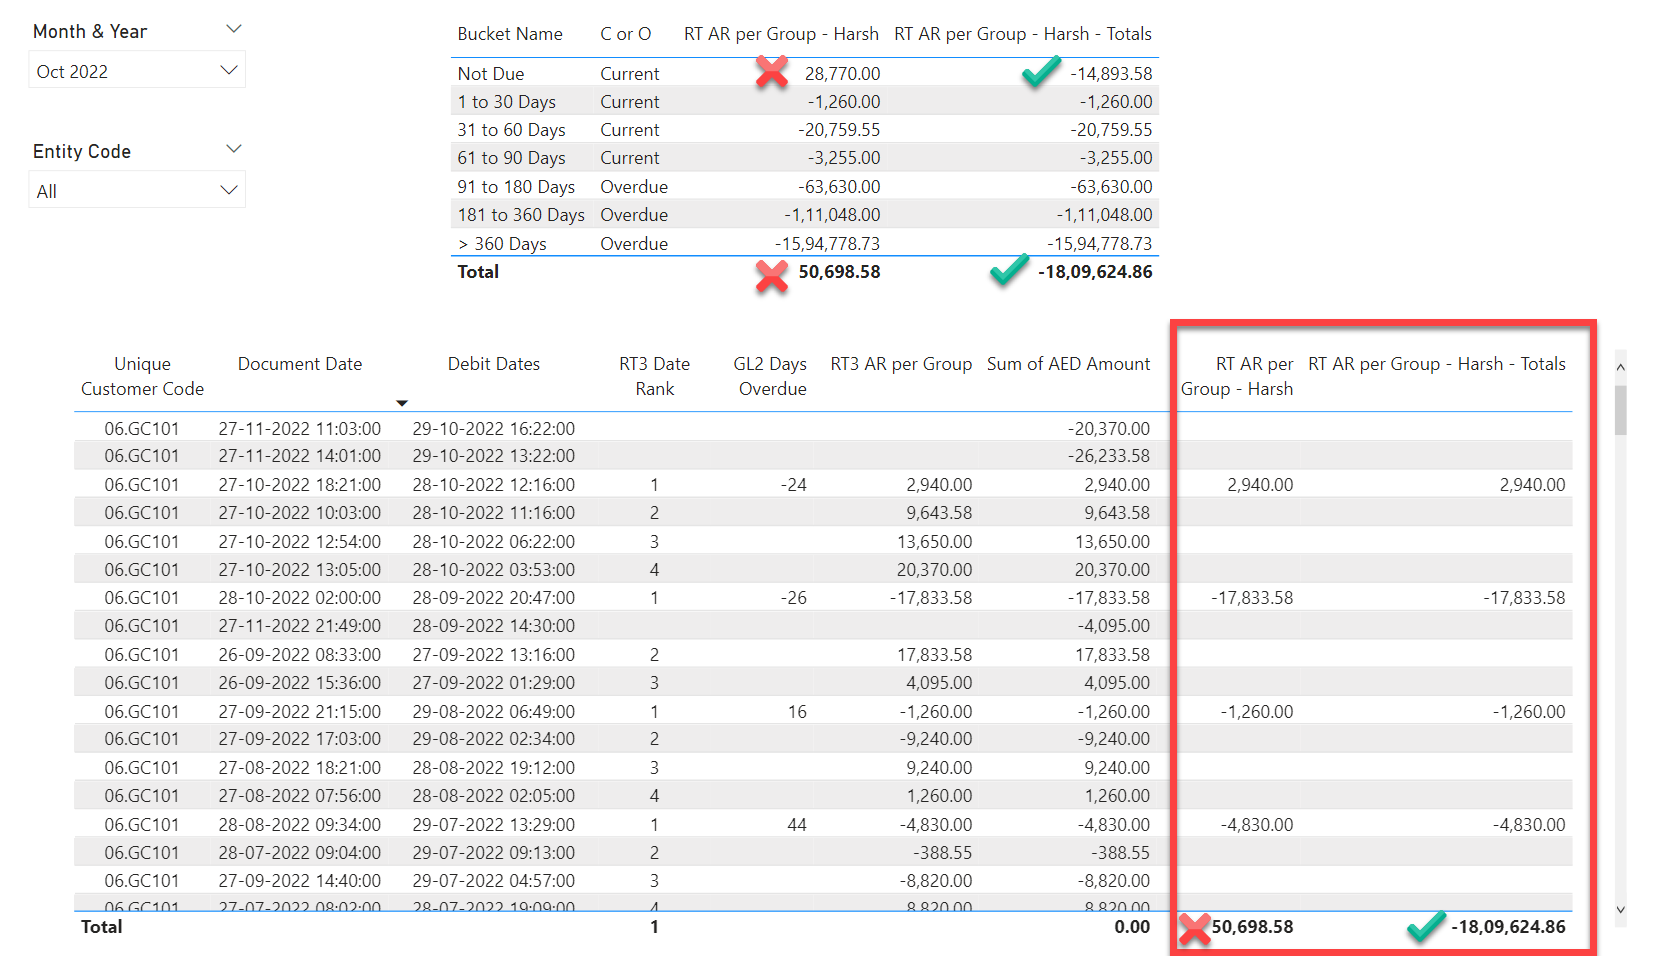
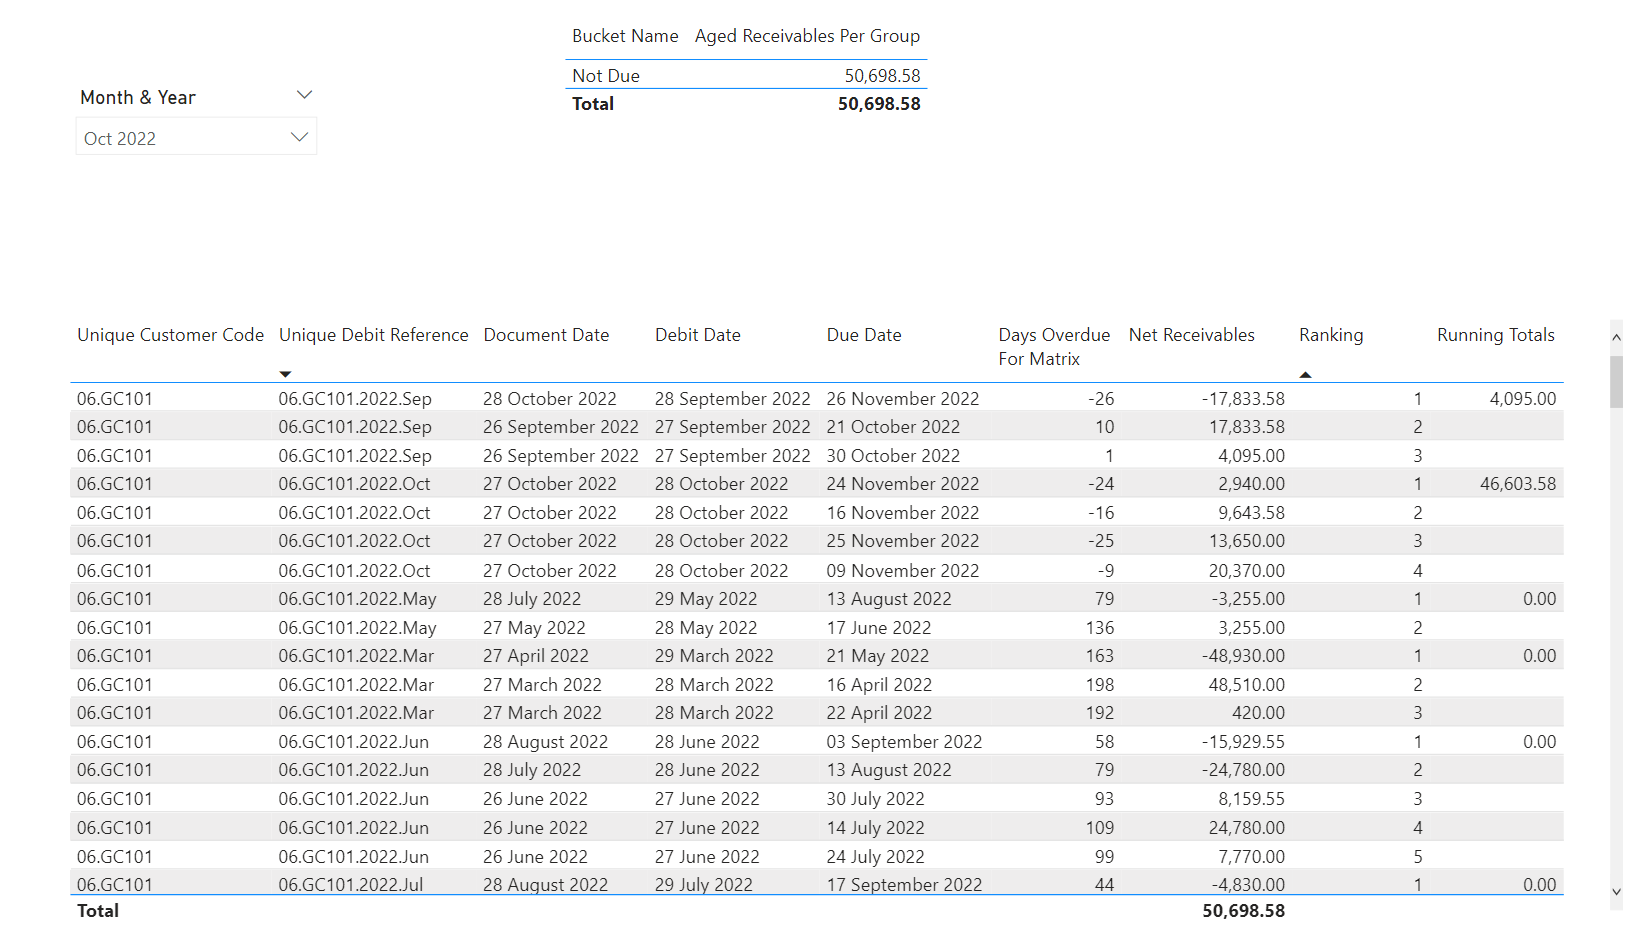
Now, I wrote the following measures to achieve the results as you had mentioned in your statement/scenario i.e., “October will have an amount of 46,603.58/- and September will have an amount of 4,095.00/-. And therefore, the correct number when selecting Oct - 2022 in the slicer should be 50,968.58/-.” Below are the measures alongwith the screenshot of the final results provided for the reference -

1. Total Amounts - (Optional) = 
SUM( GL[AED Amount] )
2. Net Receivables = 
VAR _Max_Date = 
CALCULATE( MAX( Dates[Date] ) , 
    ALLSELECTED( Dates ) )

VAR _Results = 
SUMX(
    FILTER(
        ADDCOLUMNS(
            SUMMARIZE(
                GL , 
                Entities[Unique Customer Code] , 
                DebDateRef[Unique Debit Reference] , 
                GL[Due Date] , 
                GL[Document Date] , 
                GL[Debit Date] ) , 
            "@Days_Overdue" , 
            IF( GL[Document Date] <= _Max_Date , 
                DATEDIFF( GL[Due Date] , _Max_Date , DAY ) ) , 
            "@Amounts" , 
            CALCULATE( SUM( GL[AED Amount] ) ) ) , 
        GL[Document Date] <= _Max_Date &&
        [@Days_Overdue] <> BLANK() ) , 
    [@Amounts] )

RETURN
_Results
3. Days Overdue For Aging = 
VAR _Max_Selected_Date = 
CALCULATE( MAX( Dates[Date] ) , 
    ALLSELECTED( Dates ) )

VAR _Current_Document_Date = 
SELECTEDVALUE( GL[Document Date] )

VAR _Current_Due_Date = 
SELECTEDVALUE( GL[Due Date] )

VAR _Results = 
IF( 
    _Current_Document_Date <= _Max_Selected_Date && 
    [2. Net Receivables] > 0 ,
    DATEDIFF( _Current_Due_Date , _Max_Selected_Date , DAY ) )

RETURN
_Results
4. Days Overdue For Matrix = 
VAR _Max_Date = 
CALCULATE( MAX( Dates[Date] ) , 
    ALLSELECTED( Dates ) )

VAR _Results = 
IF( ISINSCOPE( Entities[Unique Customer Code] ) , 
    SUMX(
        FILTER(
            ADDCOLUMNS(
                SUMMARIZE(
                    GL , 
                    Entities[Unique Customer Code] , 
                    DebDateRef[Unique Debit Reference] , 
                    GL[Due Date] , 
                    GL[Document Date] , 
                    GL[Debit Date] ) , 
                "@Days_Overdue" , 
                IF( GL[Document Date] <= _Max_Date , 
                    DATEDIFF( GL[Due Date] , _Max_Date , DAY ) ) ) , 
            GL[Document Date] <= _Max_Date &&
            [@Days_Overdue] <> BLANK() ) , 
        [@Days_Overdue] ) )

RETURN
_Results
5. Aged Receivables Per Group = 
CALCULATE( [2. Net Receivables] , 
    FILTER( Entities ,
        COUNTROWS(
            FILTER( 'Aged Debtor Groups' ,
                [3. Days Overdue For Aging] >= 'Aged Debtor Groups'[Min] &&
                [3. Days Overdue For Aging] <= 'Aged Debtor Groups'[Max] ) ) > 0 ) )
6. Ranking = 
VAR _Max_Selected_Date = 
CALCULATE( MAX( Dates[Date] ) , 
    ALLSELECTED( Dates ) )

VAR _Current_Document_Date = 
SELECTEDVALUE( GL[Document Date] )

VAR _Current_Unique_Debit_Reference = 
SELECTEDVALUE( GL[Unique Debit Reference] )

VAR _Current_Due_Date = 
SELECTEDVALUE( GL[Due Date] )

VAR _Results = 
IF( _Current_Document_Date < _Max_Selected_Date ,
    RANKX(
        FILTER( ALLSELECTED( GL ) ,
            GL[Unique Debit Reference] = _Current_Unique_Debit_Reference &&
            GL[Document Date] <= _Max_Selected_Date ) ,
        CALCULATE( 
            SELECTEDVALUE( GL[Debit Date] ) + 
            SELECTEDVALUE( GL[Debit Time] ) ) , ,
        DESC ,
        DENSE ) )

RETURN
IF( NOT ISBLANK( [2. Net Receivables] ) && 
    ISINSCOPE( Entities[Unique Customer Code] ) , 
    _Results )
7. Running Totals = 
VAR _Current_Unique_Debit_Reference =
SELECTEDVALUE( GL[Unique Debit Reference] )

VAR _Current_Debit_Date =
SELECTEDVALUE( GL[Debit Date] ) + SELECTEDVALUE( GL[Debit Time] )

VAR _Ranking = 
[6. Ranking]

VAR _Filtered_Table =
FILTER( ALLSELECTED ( GL ) ,
    GL[Unique Debit Reference] = _Current_Unique_Debit_Reference &&
    GL[Debit Date] + GL[Debit Time] <= _Current_Debit_Date &&
    NOT ( ISBLANK ( [6. Ranking] ) ) )

VAR _Results = 
SUMX( 
    _Filtered_Table , 
    GL[AED Amount] )

RETURN
IF( NOT ISBLANK( [2. Net Receivables] ) && 
    [6. Ranking] = 1 &&
    ISINSCOPE( Entities[Unique Customer Code] ) , 
    _Results )

I’m also attaching the working of the PBIX file for the reference purposes.

Hoping this meets your requirements.

Important Notes: -

1). Measure No. 1 is optional.

2). In my case, I achieved the solution by writing the measures from Measure No.'s 2 to 5.

3). Measure No.'s 6 and & 7 are written just because they were there in your original PBIX file and you were trying to create ananlysis based on them. In my case, they were not even required. The way these measures are written by you, they broke the data lineage and therefore, you were not able to analyse them in the aging table as well as not able to fetch those cumulative numbers where “Ranking = 1”.

4). The results while selecting the month “Oct 2022” in the slicer will be “50,698.58/-” and not “50,968.58/-”. That is,

for “Sep 2022 = 4,095.00/-” (+) “Oct 2022 = 46,603.58/-” (=) “Total Receivables = 50698.58/-”

5). In case, you would like to know/learn more about data modelling or DAX in-depth. I would sincerely recommend to please go through the EDNA education portal.

Thanks and Warm Regards,
Harsh

Accounts Receivables - Harsh.pbix (173.2 KB)

Holy cow Harsh…thank you for all the work and input…will go through it and see what all you did and try and follow the logic. Looks good though from what I can see.

May even go back to the original larger file where the document numbers are still there and try the better modeling techniques. Perhaps that is why the measures in that file are running so slowly.

Will let you know how it turns out. Thank you so very much again.