I am stuck one something would really appreciate your take on it
I am building a report that have multiple regions, and I want to use PowerBI row level filtering so certain users in each region will see the information about their region only.
Everything works as expected. The issue I’m having is that I have a pie chart that shows the percentage of sales for that region against the total sales.
Since I am using row level filtering the results sets for the other regions get filtered out and therefore the total sales will not be correct and the pie chat will display wrong results.
Row level filtering was one of the solutions I was thinking of to achieve this.
What is the best way to achieve the region segregation without creating multiple reports.
Hi Sam I have a similar query on Row Level Filtering if u dont mind me adding a similar question on this.
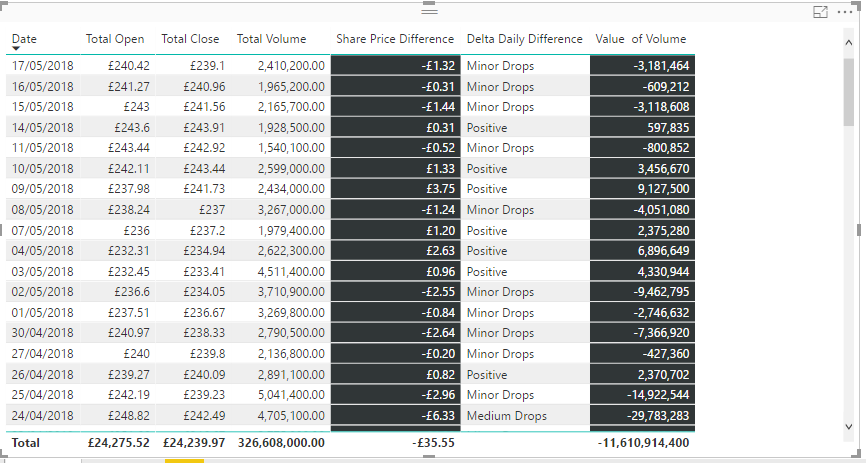
Might be something I am doing wrong. I basically have exported data from Yahoo Finance on Goldman Sachs Shares as its really fascinating data. This query I have is basically doing analysis on the “Total Open” and “Total Close” and “Share Prices Difference” let me explain further.
This has been filtered in report view for year 2018.My Main Fact Table
Okay so this is where I think I am confusing myself
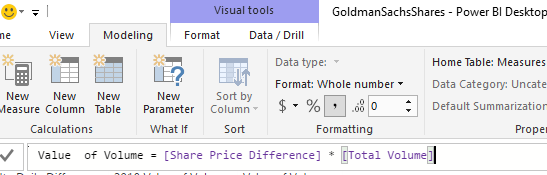
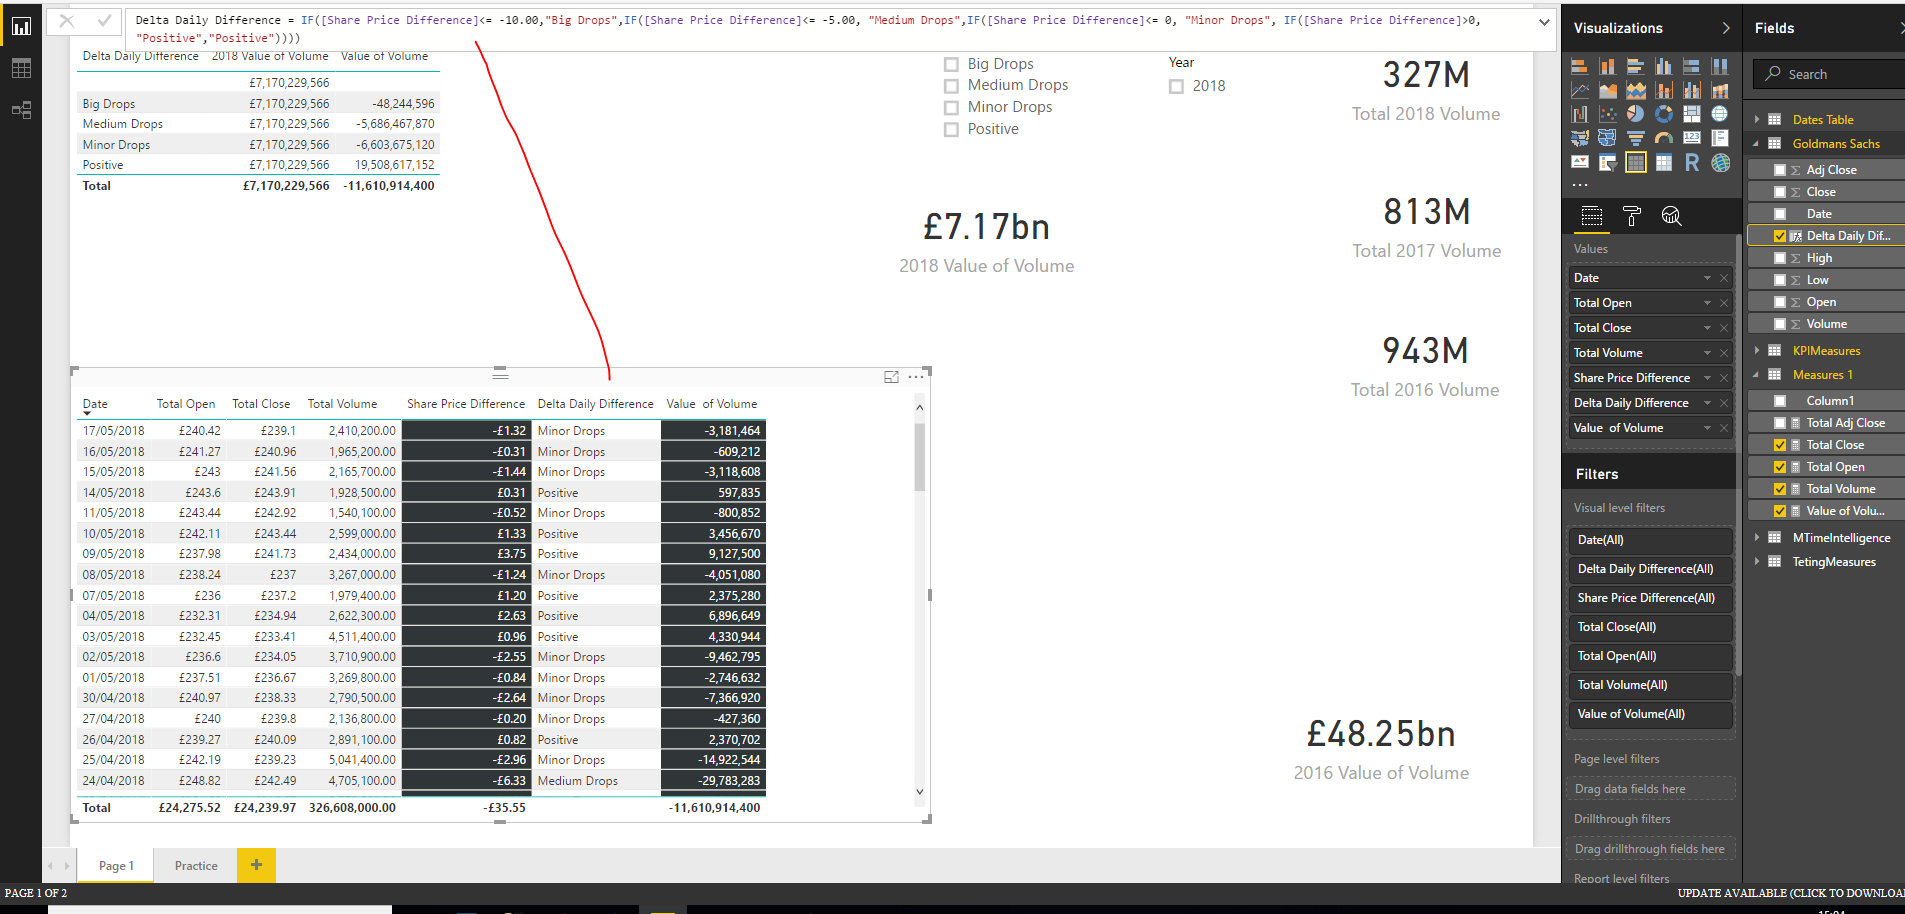
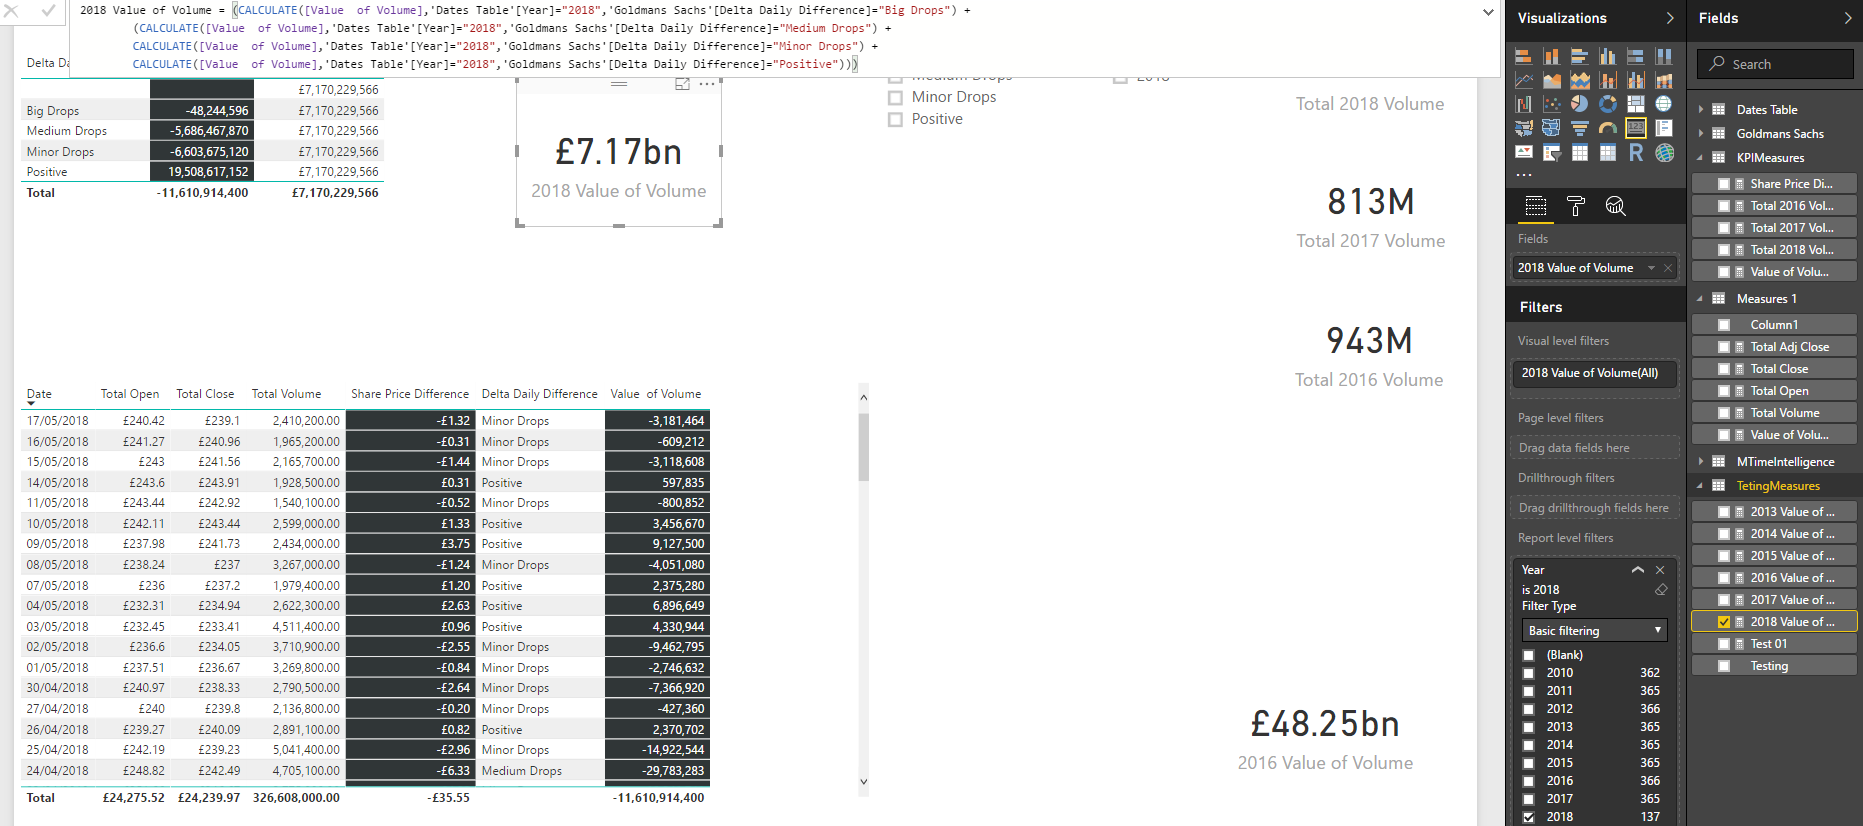
So based on Share Prices Difference I have made a category if the Share Prices has dropped by XX amout it goes into a certain bucket. I know this is not best practice, for this application as u can see i think it works fine.
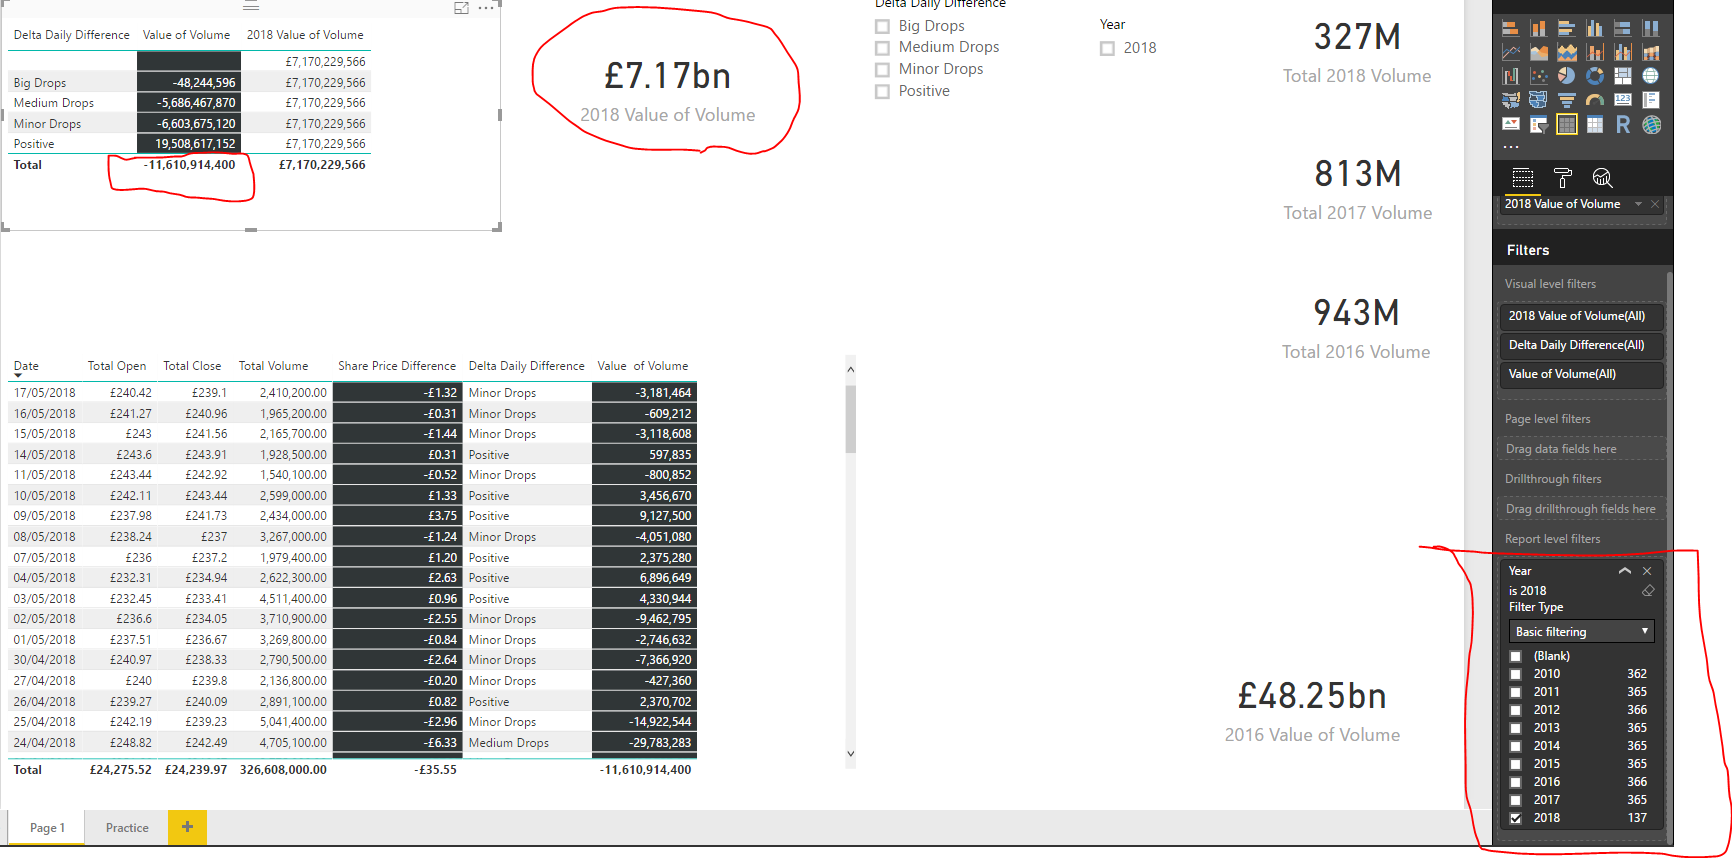
Now note the report view has been filtered for only 2018 year.
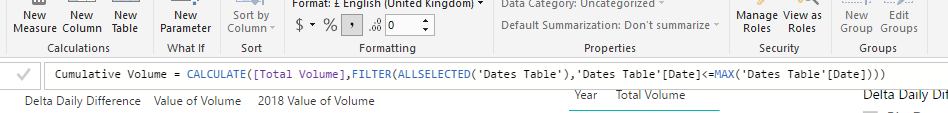
I am not confident why Value of Volume sum is showing an incorrect sum off 11B.
When i use CALCULATE I get the correct SUM.
So I think on this one, you’re just using the incorrect technique for the grouping.
There is a specific technique you want to use for grouping or segmentation and it doesn’t involve using IF statements.
See here for many video on this. You’ll find that it always the same technique or ‘pattern’ it’s just about applying it to your data in the correct way.
Remember also I think a thorough understanding of the concept of context is required here and may not be something you’ve dived into fully just yet (trust me though it is absolutely essentially before you move ahead)
Ahh! Okay no worries this actualy makes more sense now why I was getting the wrong number.
I thought I can group within the IF Statement.
I have not gone this far yet on the Advanced Grouping / DAX- it seem like Im trying to run before I can walk. No worries and thanks for the detailed response! Shrik