Rolling last 12 month sum

Hello Members,

again i kindly ask for your help, i am struggeling with a measure to create rolling 12 months comparison over years, only flull months. the model consists date-date and production quantities and an item table which is use to apply filters to the quantity.

the measure i use works perfectly BUT only if i also show 2018 in the visual, as i dont want to show it i allpy a filter an the page, but then of course 2018 is not calculated anymore so the last 12 month of 2019 are getting wrong.

this is the measure i use:
last 12 month rolling =
VAR CurrentDate = ENDOFMONTH(‘Kalender mit Feiertage’[Date])
VAR monthsback = date(YEAR((CurrentDate))-1,MONTH(CurrentDate)+1,1)
VAR Result =
CALCULATE([Quantity per month ACT (pcs)],
FILTER(ALLSELECTED(‘Uebertragene Erfassungen’),
‘Uebertragene Erfassungen’[Profildatum]>= monthsback && ‘Uebertragene Erfassungen’[Profildatum]<= CurrentDate))
Return
Result

As i understood my issue is coming from FILTER(ALLSELECTED(…)
if i try with “ALL” it doest apply the filter from item table anmore, AllSelected also doesnt’t work

how do i have to write the argument with the “Filter”?

thanks a lot in advance, kind regards
Franz

Hi @Franz,

A possible solution is to make use of Datesbetween, which calculates correct values, regardless a time slicer.

Workout:

  1. Make a measure “Last 12 month rolling” with Datesbetween DAX-function, with a dynamic calculation of “Days per Year Backwards” and “DaystillEndPrevMonth”

Example PBIX attached:
Rolling 12 months sales v2.pbix (103.7 KB)

The measure (tested) is as follows:

Last 12 months rolling = 
Var DaystillEndPrevMonth = DATEDIFF( DATE( YEAR(MAX(Kalendar[Date])) , MONTH( MAX( Kalendar[Date])), 1) , MAX(Kalendar[Date]) +1, DAY)  //corr backwards till last day previous month
Var DaysperYearBackwards =  DATEDIFF( DATE( YEAR(MAX(Kalendar[Date])) -1 , MONTH( MAX( Kalendar[Date])), DAY( MAX( Kalendar[Date])) ), MAX(Kalendar[Date]), DAY) //a full year backwards, incl evt 29feb
Var Last12MonthsRoll = CALCULATE( SUM( Verkaufen[Verkauf]), 
                            DATESBETWEEN( Kalendar[Date], max(Kalendar[Date]) - DaysperYearBackwards - DaystillEndPrevMonth + 1, MAX(Kalendar[Date]) - DaystillEndPrevMonth ))
return 
IF(ISBLANK(SUM(Verkaufen[Verkauf])),BLANK(),Last12MonthsRoll) 

Note 1 : be aware to select the Date Table (Kalendar) dates, not the dates of the fact table(s) with this DATESBETWEEN setup, based upon Kalendar-dates.

Note 2: double check needed if “DaystillEndPrevMonth” is OK, as far as I have analyzed, it is correct.

2 reports to illustrate :

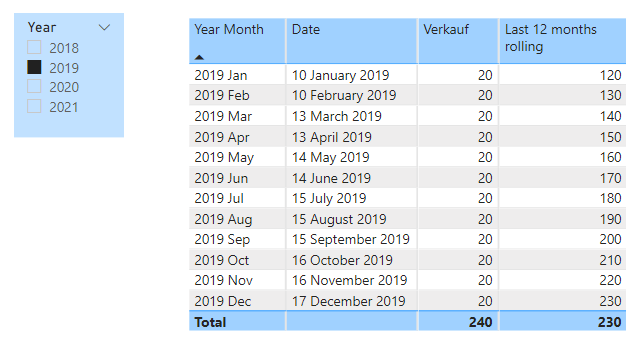
  • A) the correct last 12 months rolling from 2018 when selecting 2019

image

  • B) the “Verkauf” numbers used in 2018 and 2019

If you have further questions or remarks, please let me know.

Kind regards, Jan vd Wind

3 Likes

Hello Jan, first of all thank you for your quick help and your testmodel, i didn’t expect that this is such a complex calculation :wink:

i did some validation in excel an applied item table to model

  • i think there is a deviation from 1 month, please see pic, the result for dec 2019 should be the 240, because it would be the sum dec 2019 down to jan 2019 and so on.
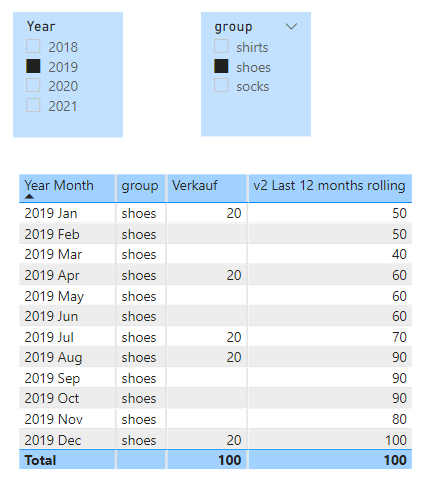
  • if there are no months sales of a certain item, there are missing months in the visual

could you please assist me on that one, the formula is a bit higher than my knowledge :slight_smile:

thanks in advance,kind regards
Franz


pic3
Rolling 12 months sales v2 (2).pbix (106.7 KB)

Hello @Franz

I made two adjustments to the formula, now the formula results in a rolling 12 months including current (MTD) figures, and it always gives the rolling 12 months number, regardless if there are sales in a month.
It was late, should have read your request better . . and previously I made the rolling 12 months blank if there were no sales.

Revised PBIX
Rolling 12 months sales v2 (2).pbix (107.3 KB)

Revised DAX formula including an example explanation, how the calculation is done:

v2 Last 12 months rolling = 
Var DaystillEndCurrentMonth = DATEDIFF( DATE( YEAR(MAX(Kalendar[Date])) , MONTH( MAX( Kalendar[Date])) + 1, 1) , MAX(Kalendar[Date]) +1, DAY)  //corr forwards till last day current month
                 // example result of formula :  today = 15 september 2021   --> DateDiff ( Date year 2021,  Month 9 + 1 , day 1 versus 2021, 9, 15+1) in DAY = 15 ( 1 Oct - 16 Sep = 15, leads to EOM)
Var DaysperYearBackwards =  DATEDIFF( DATE( YEAR(MAX(Kalendar[Date])) -1 , MONTH( MAX( Kalendar[Date])), DAY( MAX( Kalendar[Date])) ), MAX(Kalendar[Date]), DAY) //a full year backwards, incl evt 29feb
                 // example result of formula : today = 15 september 2021  --> DateDiff ( Date year 2021 - 1, Month 9,  day 15 versus  2021, 9, 15 in Day = 365 (in this period no 29 Feb)
Var Last12MonthsRoll = CALCULATE( SUM( Verkaufen[Verkauf]), 
                            DATESBETWEEN( Kalendar[Date], max(Kalendar[Date]) - DaysperYearBackwards + DaystillEndCurrentMonth + 1, MAX(Kalendar[Date]) + DaystillEndCurrentMonth ))
                //example result of formula  for 15 september 2021 -->  DatesBetween ( 15 sep 2021 - 365 (15 sep 2020) + 15 (30 sep 2020) + 1 (1 okt 2020)-- AND -- 15 sep 2021 + 15 (30 sep 2021)  
return  Last12MonthsRoll                             
//IF(ISBLANK(SUM(Verkaufen[Verkauf])),BLANK(),Last12MonthsRoll) // give no rolling 12 months figure when there is no sales in a month

image

PS : if you have sales till 15 September 2021, it should be sufficient for “DatesBetween” to go till 15 September 2021, now the formula is set up to go till 30 September 2021, this does however not harm the result.

Mit freundlichen Grüßen,
Jan vd Wind

1 Like

Hi @Franz

Try this DAX code pattern

Rolling 12 Month Sales :=
CALCULATE (
    SUM ( Table[Sales] ),
    DATESBETWEEN (
        Calendar[Date],
        NEXTDAY ( SAMEPERIODLASTYEAR ( LASTDATE ( Calendar[Date] ) ) ),
        LASTDATE ( Calendar[Date] )
    )
)

Hello Jan, thansk very much for your effort on weekend, i implemented measure and found some deviations, only in a few month, i was abel to solve by using this “Endofmonth”

Forum last 12 month =
CALCULATE([Quantity per month ACT (pcs)],
DATESBETWEEN(‘Kalender mit Feiertage’[Date]
,
NEXTDAY ( SAMEPERIODLASTYEAR ( ENDOFMONTH( (‘Kalender mit Feiertage’[Date] ) ) )),
ENDOFMONTH( ( ‘Kalender mit Feiertage’[Date] )
)
)
)

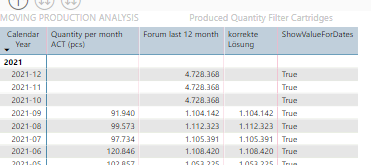
actually the result is perfectly correct, but now my measure predicts values for Nov 2021, where there is no quantity :frowning:

i really didnt’t expect that this one is so tricky, … i will look again tomorrow night, thanks very much again

kind regards from Austria
Franz

this is the actual behavior, a month is only offered in page filter when there is data, but Nov2021 is not offered because the is no data :slight_smile:

Hi @Franz,

a calculated date table can solve the latest issue. The minimum and maximum dates are derived from fact tables, in this example from sales dates; as a consequence no periods showed outside the sales dates.

PBIX with calculated Date table and some testing (results) attached:
Rolling 12 months sales v4.pbix (122.7 KB)

I also did some testing, see also attached PBIX, with sales for Product A of 1 Euro for every day over the years 2018 - 2021, with the most recent sales per 15 September 2021

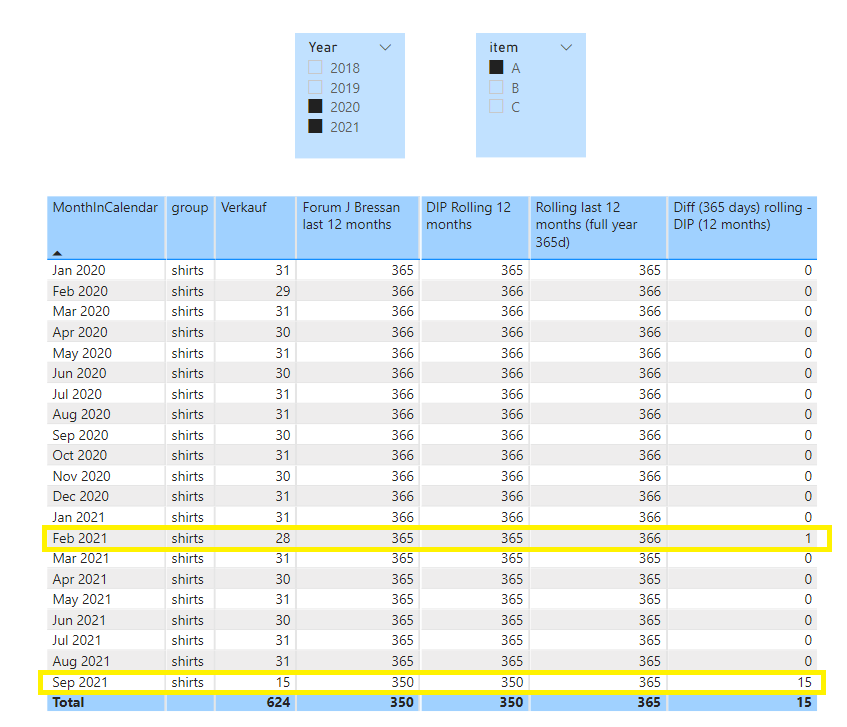
The formula of J Bressan works if you want a 12 months rolling (Oct 20 - Sep 21), including the current month with half monthly sales (till 15 September 2021), the 12 months start at 1 October 2020):

Forum JBressan last 12 months = 
      CALCULATE( SUM( Verkaufen[Verkauf]),
                DATESBETWEEN(CalcDateT[Date],
                     NEXTDAY ( SAMEPERIODLASTYEAR (CalcDateT[Date])),
                     LASTDATE(  CalcDateT[Date]))) 

An alternative shorter standard DAX formula is using DatesInPeriod, which give the same result:

DIP Rolling 12 months = CALCULATE( SUM( Verkaufen[Verkauf]), 
                           DATESINPERIOD(CalcDateT[Date] , MAX( CalcDateT[Date]),-1,YEAR))

The two formulas above calculates with the “Year-Month” context given, (12 MONTHS backwards including the current month, which is September 2021, starting in October 2020) , whereby September 2021 only has half of the normal sales.

=================
When adding EndOfMonth in the formula, a full year on a daily base is calculated, the 12 months rolling for September 2021 is the 12 months sales of 365 days, back to 16 September 2020

Rolling last 12 months (full year 365d) =  
      CALCULATE( SUM( Verkaufen[Verkauf]),
                DATESBETWEEN(CalcDateT[Date],
                     NEXTDAY ( SAMEPERIODLASTYEAR ( ENDOFMONTH( (CalcDateT[Date])))),
                     ENDOFMONTH(  CalcDateT[Date]))) 

Obviously it is your choice what rolling 12 months you want to have.

If you have further questions or remarks, please let me know.

Kind regards Jan vd Wind

1 Like

Hi @Franz

Add this Dax code to validate last date with sales

ShowValueForDates = 
VAR LastDateWithData =
    CALCULATE ( MAX ( 'Sales'[Order Date] ), REMOVEFILTERS () )
VAR FirstDateVisible =
    MIN ( 'Date'[Date] )
VAR Result = FirstDateVisible <= LastDateWithData
RETURN
    Result

and update

Rolling 12 Month Total =
IF (
    [ShowValueForDates],
    CALCULATE (
        SUM ( 'Table'[Sales] ),
        DATESBETWEEN (
            'Date'[Date],
            NEXTDAY ( SAMEPERIODLASTYEAR ( LASTDATE ( 'Date'[Date] ) ) ),
            LASTDATE ( 'Date'[Date] )
        )
    )
)
1 Like

@jbressan,

Thanks for sharing !
The measure “ShowValueForDates” is much cleaner then using a calculated Date table

Kind regards JW

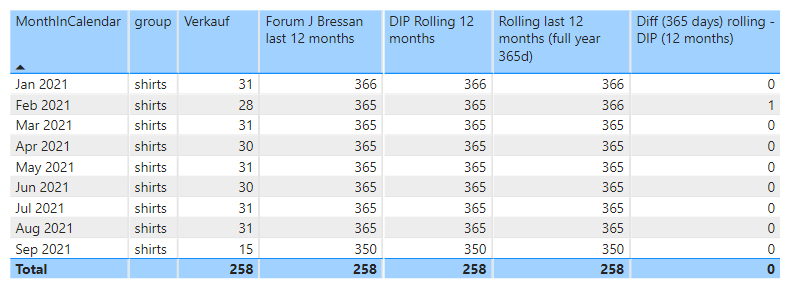
PS when using this measure in the 3 measures of Last 12 months rolling, the difference for Sept 2021 disappears, all give 350
So I tend to believe that using “ENDOFMONTH” should not be used in the third measure, NEXTDAY ( SAMEPERIODLASTYEAR ( ENDOFMONTH( CalcDateT[Date]))),
ENDOFMONTH( CalcDateT[Date]))) )

1 Like

good evening,

after a quite long testing (annexed if someone needs) i got solution now, with this two measures

    Forum last 12 month = 
CALCULATE(sum('Uebertragene Erfassungen'[Gutmenge]),
    DATESBETWEEN('Kalender mit Feiertage'[Date]
        ,
        NEXTDAY ( SAMEPERIODLASTYEAR ( ENDOFMONTH( ('Kalender mit Feiertage'[Date] ) ) )),
        ENDOFMONTH( ( 'Kalender mit Feiertage'[Date] )
    )
)
)

as this also gives result for future, i applied if statement:

Result = if([Quantity per month ACT (pcs)]>0,[Forum last 12 month])

i guess i need to spend a bit more time on time function, btw. this forum, so the people in it are great,

thank you very much for your help with this tricky case

kind regards from Austria
Franz

data.xlsx (16.4 KB)

Hello,

Formula 12 month total is correct, “show value” always gives “True”, i replaced it.

thank you very much, kind regards
FRanz

2021-10-03_23h21_22

Thank you very much for your help and effort, couldn’t geit it running unfortunately

kind regards
Franz